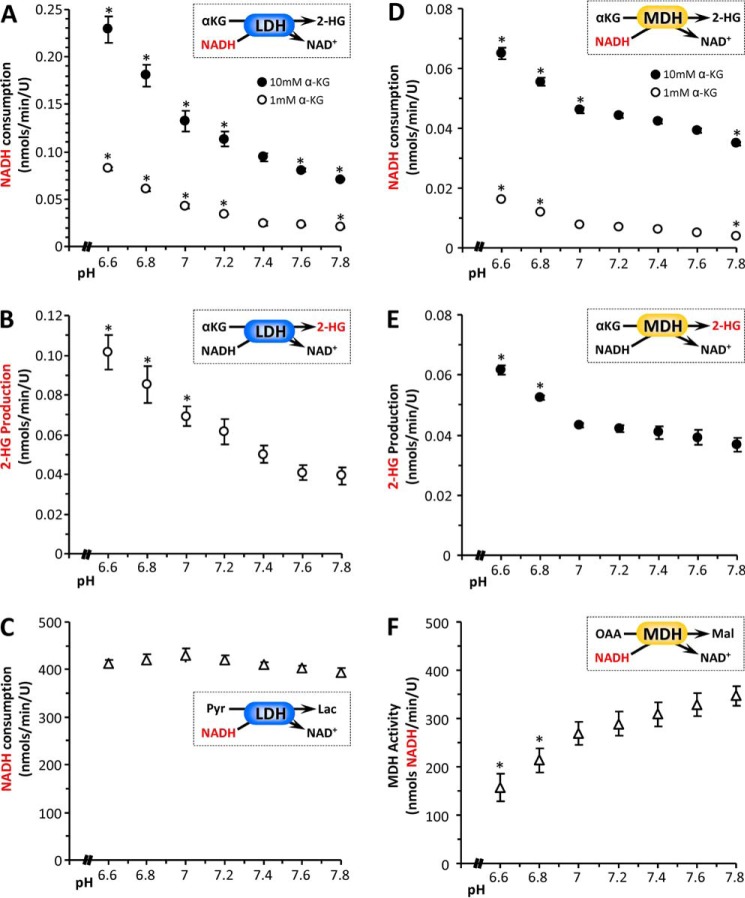
FIGURE 3.
pH dependence of 2-HG generation by lactic or malic dehydrogenases. The 2-HG synthetic activity of isolated LDH was assayed spectrophotometrically as NADH consumption (A) or by direct LC-MS/MS assay of 2-HG formation (B). The insets in each panel show reaction schemes, with the measured parameter (y axis of graph) highlighted in red. A, NADH consumption at various pH values, for LDH in the presence of 1 mm (white circles) or 10 mm (black circles) α-KG. B, 2-HG production at various pH values, for LDH in the presence of 1 mm α-KG. C, native pyruvate to lactate converting activity of LDH at various pH values, assayed spectrophotometrically as NADH consumption. Similar experiments were also performed with isolated MDH. D, NADH consumption at various pH values, for MDH in the presence of 1 mm (white symbols) or 10 mm (black symbols) α-KG. E, 2-HG production at various pH values, for MDH in the presence of 10 mm α-KG. (Note that with MDH, the high concentration of α-KG was necessary because of the low sensitivity of LC-MS/MS-based 2-HG assay). F, native MDH activity (oxaloacetate to malate) at various pH values, assayed spectrophotometrically as NADH consumption. (Note that MDH activity was measured in the reverse direction, i.e. oxaloacetate to malate, because of thermodynamic constraints). All data are means ± S.E., n > 3. *, p < 0.05 (two-way ANOVA followed by Student's t test) compared with the corresponding value at pH 7.4. Where error bars appear absent, they are sufficiently small as to be wholly contained within the data symbols.

