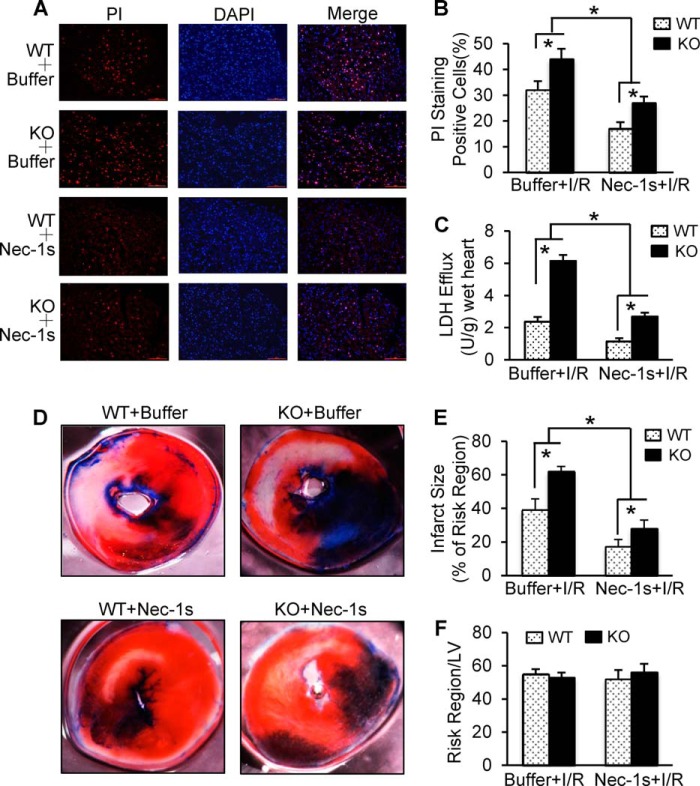
FIGURE 7.
A and B, representative images (A) and quantitative results (B) of the PI staining assay in KO and WT hearts after ex vivo I/R (30 min/1 h). Red, PI-positive nuclei; blue, 4′, 6-diamidino-2-phenylindole-stained nuclei. Scale bars, 100 μm. (n = 5 for KO and n = 6 for WT in buffer-injected samples; n = 6 KO and WT in Nec-1s-treated group; *, p < 0.05 versus WT controls.) C, total LDH in coronary effluent collected during the first 10 min of reperfusion was significantly decreased in Nec-1s-treated hearts compared with buffer-treated samples (n = 5 for KO and n = 6 for WT in I/R controls; n = 6 for KO and WT in Nec-1s-treated group; *, p < 0.05 versus WT controls). D–F, Nec-1s treatment greatly reduced in vivo myocardial infarct size after 30 min of left anterior descending artery occlusion followed by 24 h of reperfusion. Representative images (D) and quantitative analysis (E) of the ratio of infarct to risk region are shown (n = 8 for KO and n = 10 for WT in buffer controls; n = 9 for KO and WT in Nec-1s-treated group; *, p < 0.01 versus WT controls). Error bars represent mean ± S.D.

