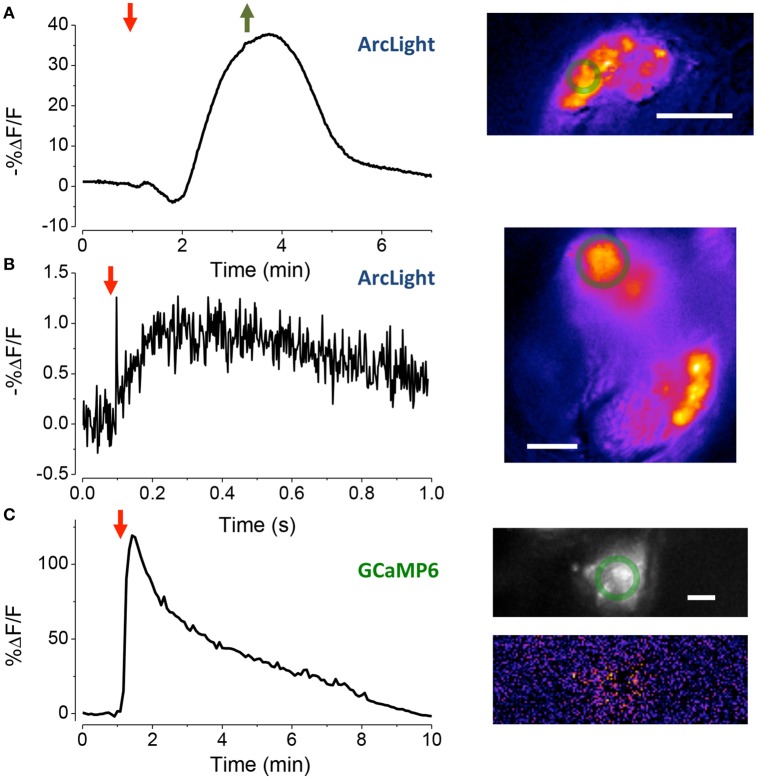
Figure 4.
Assessing the vitality of exposed JOs. (A) Response of sensory cells in JO expressing ArcLight to the perfusion of HiK (red arrow) and restoration of normal saline (green arrow). Inset, pseudo-color image of difference between the image prior to stimulation and at its peak. Scale bar 20 μm. The green circles are the regions-of-interest used to produce the time traces. (B) Local electrical stimulation (arrow, 200 μs, 0.1 mA) of sensory cells in JO expressing ArcLight. Scale bar 10 μm. (C) Response of JO expressing GCaMP6 to application of pymetrozine (arrow, 3.4 μM). Top inset fluorescence, bottom inset pseudo-color difference image. Scale bar 20μm.

