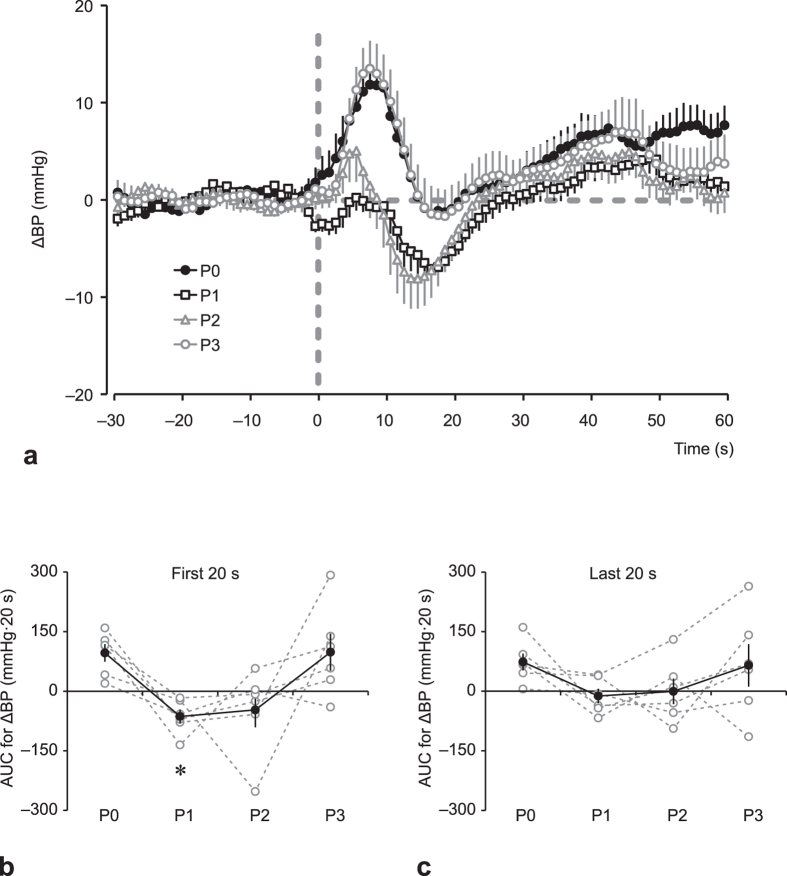
Figure 2. Averaged arterial blood pressure responses (ΔBP) to head-up tilt (HUT) test at: 2–4 months before launch (P0, closed circle); 1–4 days after return (P1, open square); 11–15 days after return (P2, open triangle); and 2 months ± 12 days after return (P3, open circle).
(a) Each data point is presented as a difference from the 30 s average just prior to the induction of HUT. Area under the curve (AUC) of ΔBP during the first 20 s of HUT (b) and the last 20 s of HUT (c). Open circle and dashed line represent individual data, and closed circle and solid line represent mean ± standard error of the mean for 6 subjects. *P < 0.05 vs. P0.

