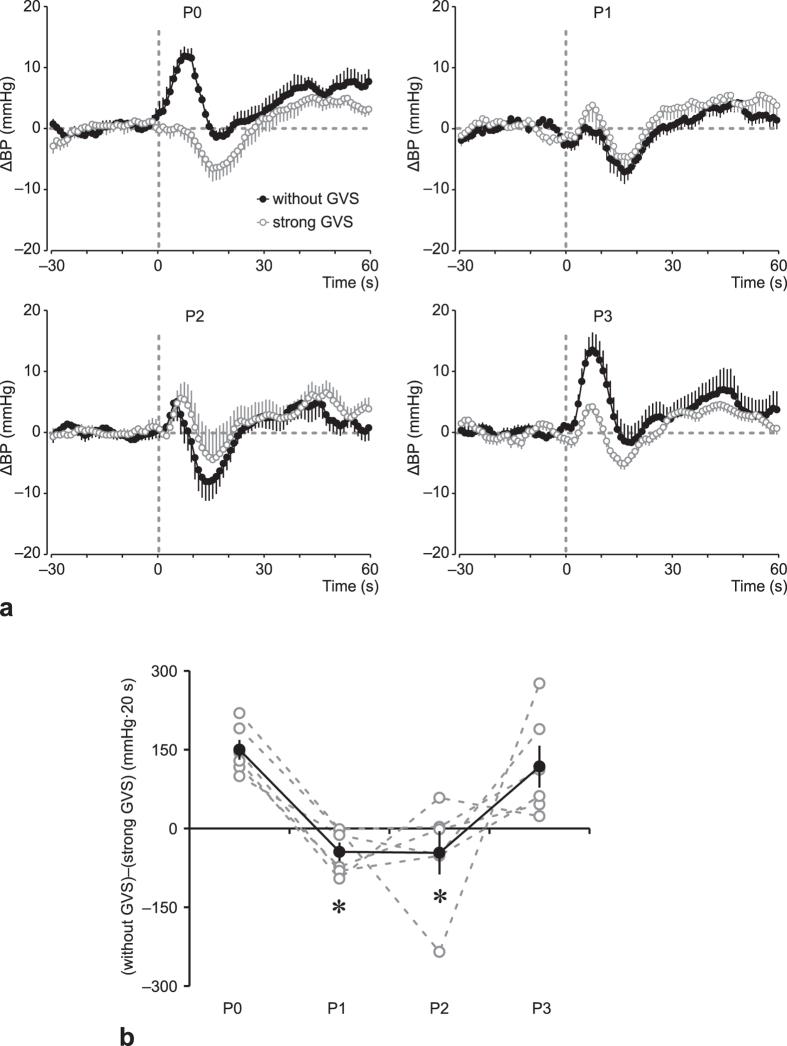
Figure 3.
Averaged arterial blood pressure responses (ΔBP) to head-up tilt (HUT) test without GVS (closed circle) and with strong GVS (open circle) at 2–4 months before launch (P0); 1–4 days after return (P1); 11–15 days after return (P2); and 2 months ± 12 days after return (P3) (a). Each data point is presented as a difference from the 30 s average just prior to the induction of HUT. Sum of differences in ΔBP between the initial response (within the first 20 s) to HUT without GVS and HUT with strong GVS [(without GVS)−(strong GVS)] (b). Open circle and dashed line represent individual data, and closed circle and solid line represent mean ± standard error of the mean for 6 subjects. *P < 0.05 vs. P0.

