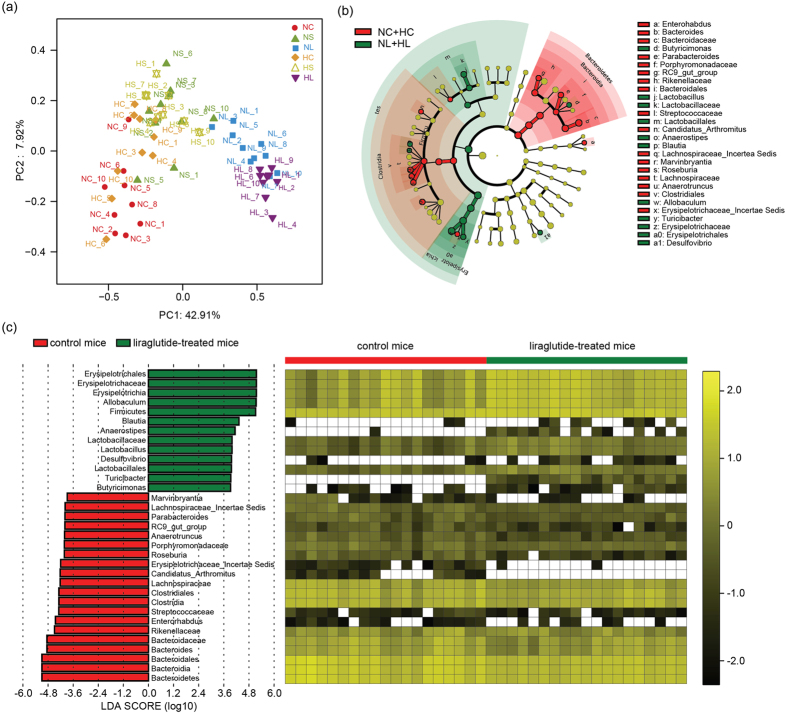
Figure 2. The overall structure and composition of the gut microbiota in liraglutide-treated mice differed significantly from that in the other group.
PCoA plots based on unweighted Unifrac metrics (a) Each symbol represents a sample in from the NC, NS, NL, HC, HS and HL groups, respectively. The cladogram depicts the phylogenetic distribution of microbial lineages in faecal samples from mice with or without liraglutide treatment (b) Differences are represented in the colour of the most abundant group. Key phylotypes of the gut microbiota responding to liraglutide treatment (c) The left histogram shows the lineages with LDA values of 3.8 or higher as determined by LEfSe. The right heat map shows the relative abundance (log10 transformation) of OTUs.

