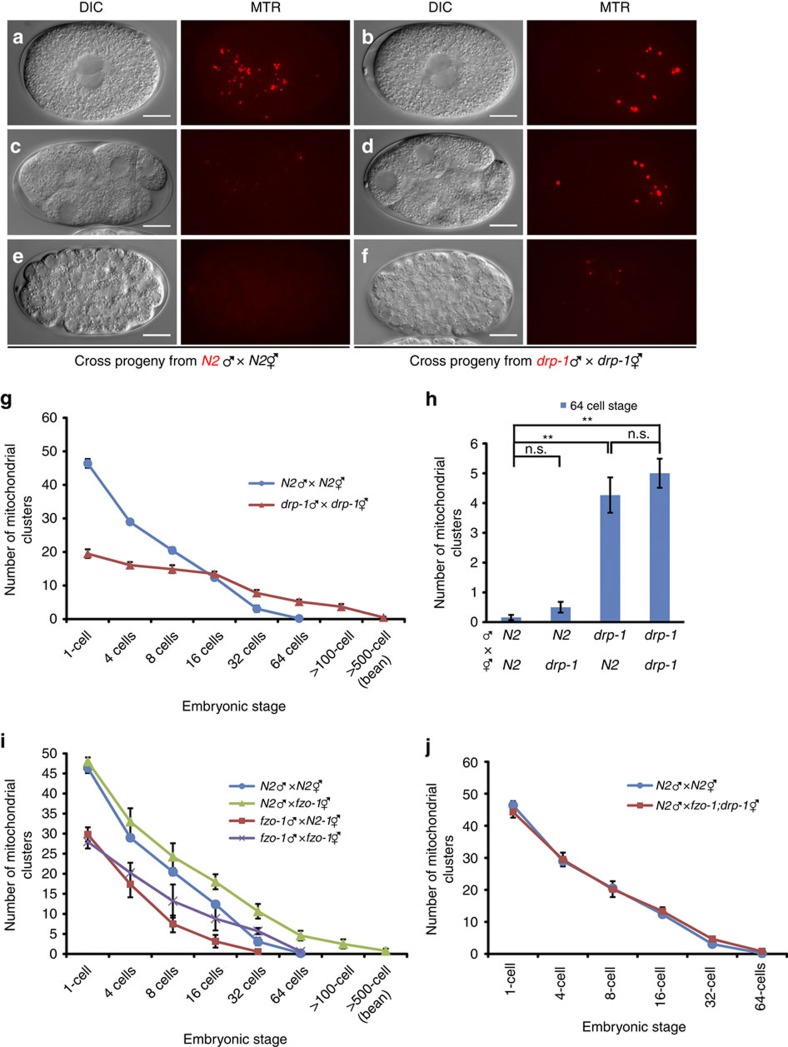
Figure 1. Mitochondrial dynamics regulate PME.
(a–f) Delayed PME caused by a defect in paternal mitochondrial fission. Differential interference contrast (DIC) and MitoTracker Red (MTR) images of cross-fertilized embryos from mating of MTR-stained N2 males or drp-1(tm1108) males with unstained N2 or drp-1(tm1108) hermaphrodites are shown. Red dots are mitochondrial clusters stained by MTR. The stages of embryos shown are: 1-cell embryos at the pronuclear-meeting stage (a,b), 8-cell stage embryos (c,d), and approximately 100-cell stage embryos (e,f). Scale bars represent 10 μm. (g,i,j) The numbers of MTR-stained paternal mitochondrial clusters in cross-fertilized embryos from the indicated crosses between MTR-stained males and unstained hermaphrodites were scored at different stages of embryos (1-cell, 4-cell, 8-cell, 16-cell, 32-cell, 64-cell, >100-cell and bean stages). Data shown are mean±s.e.m. (n=10). (h) The numbers of MTR-stained paternal mitochondrial clusters in 64-cell stage cross-fertilized embryos from the indicated crosses were scored as in g. Data shown are mean±s.e.m. (n=15). The significance of difference between different mating experiments was determined by unpaired t test. **P<0.01. ‘n.s.' indicates no significant difference.

