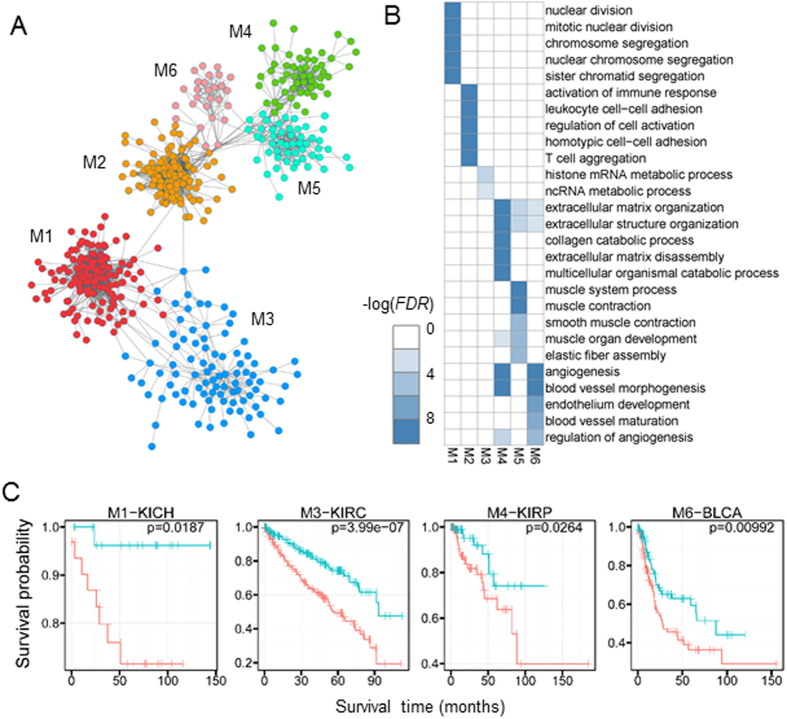
Figure 2. The pan-cancer network.
(A) Topological organization of the pan-cancer network which show six modular subnetworks marked with different colours. (B) Enriched biological functions of pan-cancer subnetworks. Each row represents a GO BP term and each column corresponds to a pan-cancer subnetwork. For each subnetwork, FDRs are calculated using Fisher’s exact test and Benjamini-Hochberg correction59. For each subnetwork, we only show the top five significant terms. Each pixel represents a −log(FDR) (FDR ≤ 0.01). FDRs under 1 × 10⁻¹⁰ are changed into 1 × 10⁻¹⁰ for convenience. (C) Pan-cancer subnetworks relate to prognostic information. For a given cancer type and a given pan-cancer subnetwork/module, patients are divided into two groups based on the median of the ME score. The Kaplan-Meier survival curves are drawn for each group. Four representative cases are shown65 with P values calculated by log rank sum test. Each subfigure corresponds to a subnetwork and a cancer type.

