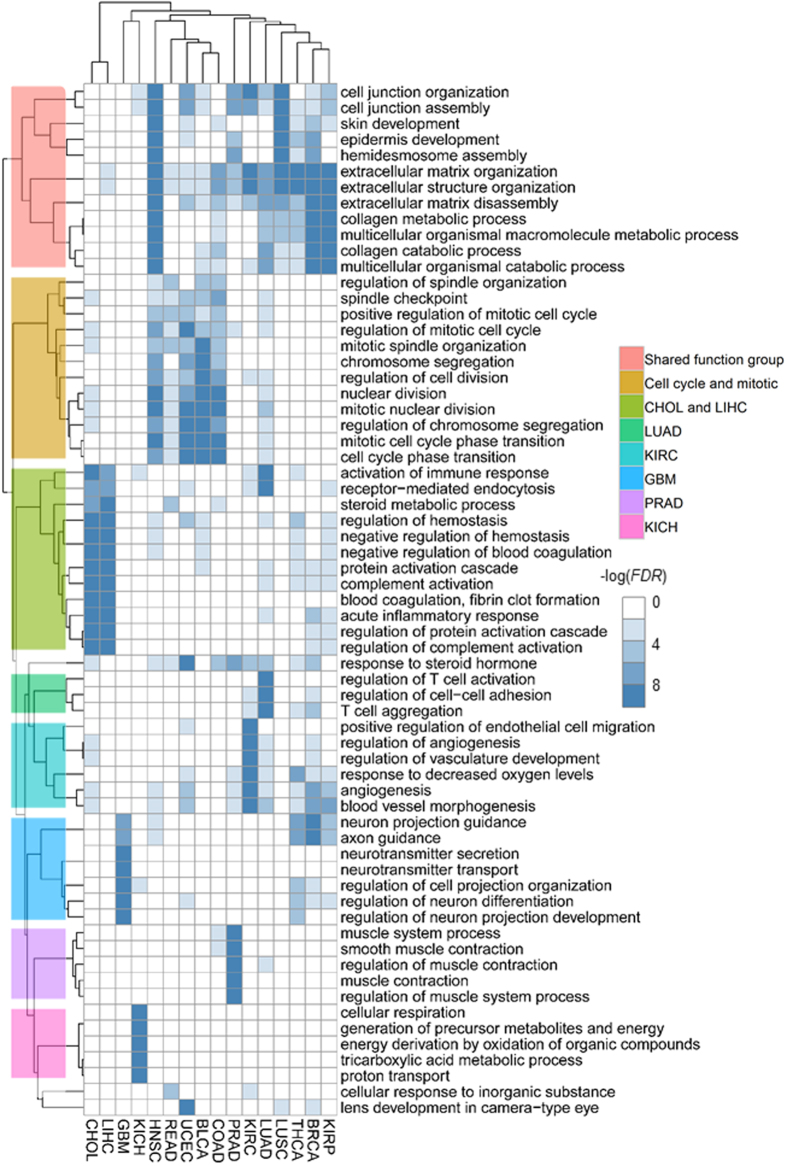
Figure 3. Biological functions of cancer type-specific subnetworks.
Each row represents a GO BP term and each column corresponds to a cancer type-specific subnetwork. For each network, FDRs are calculated using Fisher’s exact test and Benjamini-Hochberg correction59. Each pixel represents a −log(FDR) (FDR ≤ 0.01). For each network, we only show the top five significant terms. FDRs under 1 × 10⁻¹⁰ are changed into 1 × 10⁻¹⁰ for convenience. Rows and columns are ordered according to the results of hierarchical clustering (Euclidean distance and average linkage). The dendrogram of BP terms is marked by eight different groups, including shared functional group, cell cycle group and six cancer type-specific ones.

