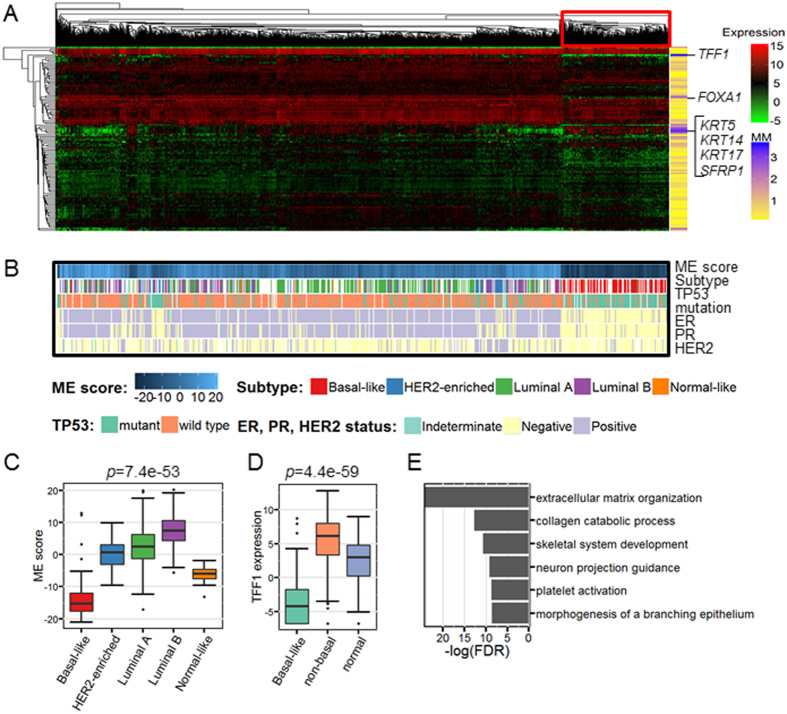
Figure 4. BRCA subnetwork is relevant to the basal-like subtype significantly.
(A) Gene expression heatmap of the BRCA subnetwork (module) genes. The genes (rows) and samples (columns) are ordered according to the results of hierarchical clustering (Euclidean distance and average linkage). Those most contributing genes include three basal like markers namely KRT5, KRT14 and KRT17 and a famous prognostic marker TFF1. Module memberships (MM, normalized factor loadings) are indicated along the rows. (B) Important markers distinguish high ME score basal-like patients from others. ME scores, subtype information, ER status, PR status, HER2 status and TP53 mutation status are shown. ‘Equivocal’ of HER2 status is deemed as missing values. All missing values are in white. Patients are in the same order as in the expression heatmap. (C) Distribution of the ME scores in terms of intrinsic subtypes. P value is calculated by Kruskal-Wallis test. (D) Distribution of the TFF1 gene expression (TMM normalization data) in terms of the basal-subtype and others. Luminal A, luminal B, HER2 enriched and normal like subtypes are merged as “non-basal” group. P value is calculated by Kruskal-Wallis test. (E) Functional enrichment analysis show BRCA subnetwork is related to cell proliferation. FDR is calculated using Fisher’s exact test and Benjamini-Hochberg correction59. For box plots, the bottom, top, and middle bands of the boxes indicate the 25th, 75th, and 50th percentiles, respectively. Whiskers extend to the most extreme data points no more than 1.5 interquartile range from the box. FDR (or p value) obtained with the Kruskal-Wallis test are provided at the top of the boxplots.

