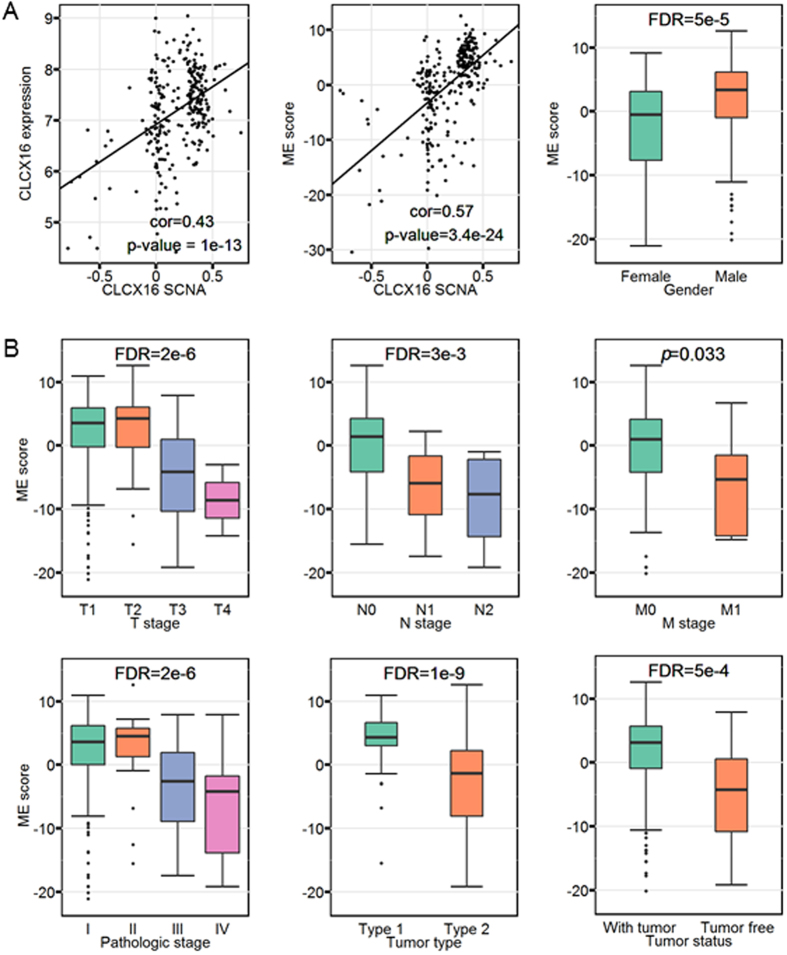
Figure 5. KIRP subnetwork is relevant to SCNA significantly.
(A) KIRP subnetwork (module) relates to the core SCNA. Left: scatter plot of CLCX16 SCNA versus CLCX16 gene expression. Each point represents a patient. The regression line in the panel is calculated by least squares. Pearson’s correlation coefficient between CLCX16 SCNAs and CLCX16 gene expression and respective p value is shown at the bottom of the panel. Middle: scatter plot of CLCX16 SCNAs versus ME scores. Right: distribution of the ME scores in terms of gender. (B) The association of KIRP subnetwork with clinical information. Distribution of the ME scores in terms of AJCC (pTNM) T stage, N stage, M stage, pathologic tumor stage, tumor status and tumor type. For box plots, the bottom, top, and middle bands of the boxes indicate the 25th, 75th, and 50th percentiles, respectively. Whiskers extend to the most extreme data points no more than 1.5 interquartile range from the box. FDR (or p value) for the Kruskal-Wallis test are provided at the top of the boxplots59.

