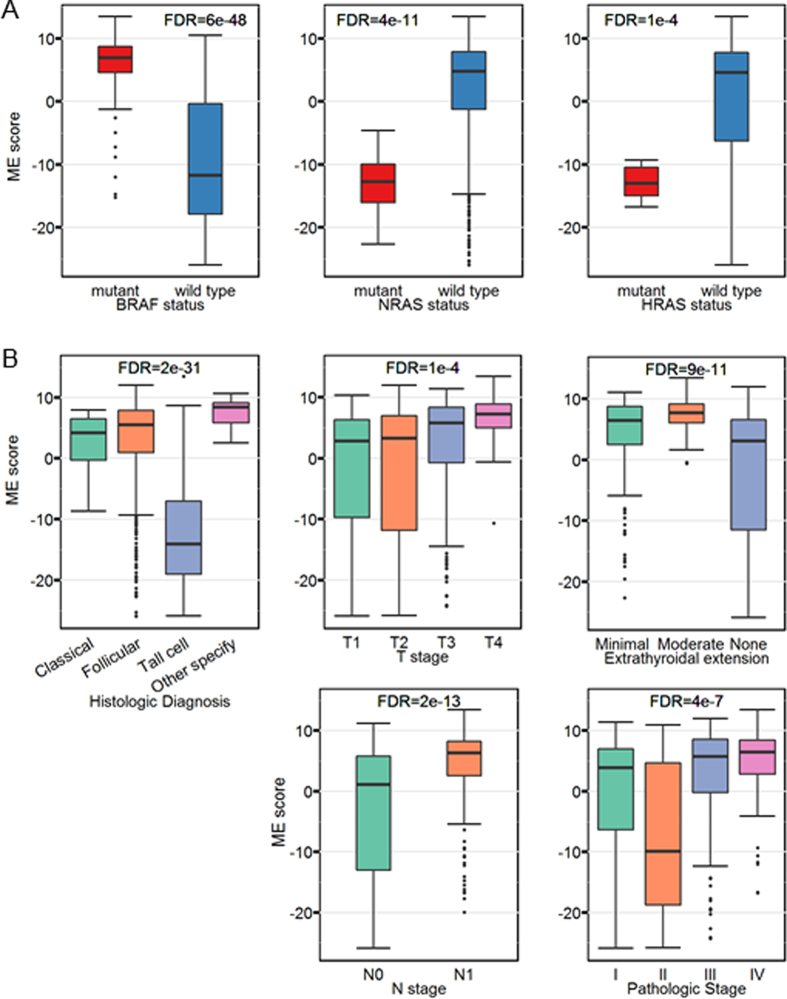
Figure 6. The association of THCA subnetwork with BRAF pathway.
(A) THCA subnetwork (module) is associated with RAF-RAS mutation. Distribution of the ME scores in terms of BRAF, NRAS and HRAS mutation status. (B) The association of THCA subnetwork with clinical information. Distribution of the ME scores in terms of AJCC (pTNM) T stage, extrathyroidal extention (this partition of patients is based on T stage), N stage, and pathologic tumor stage. For box plots, the bottom, top, and middle bands of the boxes indicate the 25th, 75th, and 50th percentiles, respectively. Whiskers extend to the most extreme data points no more than 1.5 interquartile range from the box. FDR (or p value) for the Kruskal-Wallis test are provided at the top of the boxplots59.

