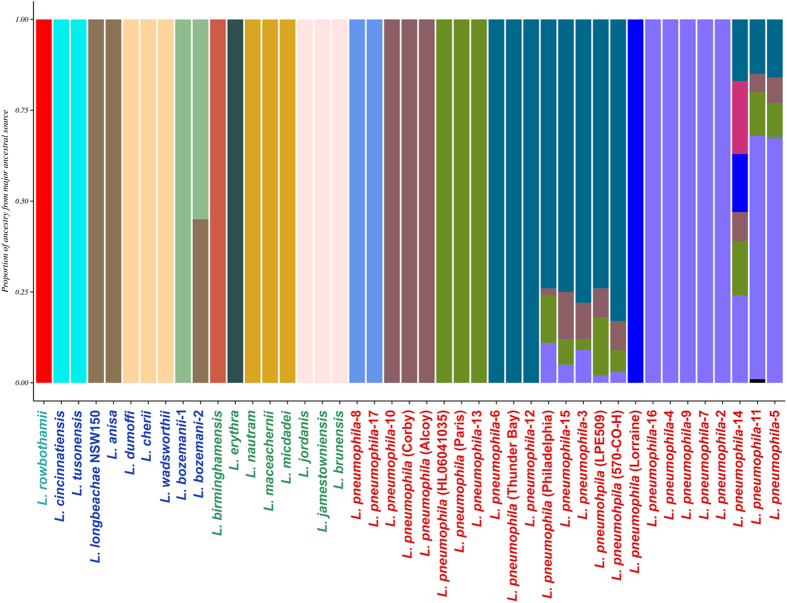
Figure 5. Admixture analysis of Legionella species.
Mixture and admixture analyses were conducted using the software BAPS. This hierarchical Bayesian model-clustering based on core SNP alignment estimated 23 clusters/ancestral populations at the finest hierarchical level. Each color represents one of the genetically differentiated ancestral Legionella groups, and each vertical colored bar corresponds to one strain/species. When a vertical bar shows two or more colors, each color corresponds to one of the groups, showing evidence for admixture; the proportion of every color in the bar reflects the proportion of the isolate coming from the group represented by that particular color.

