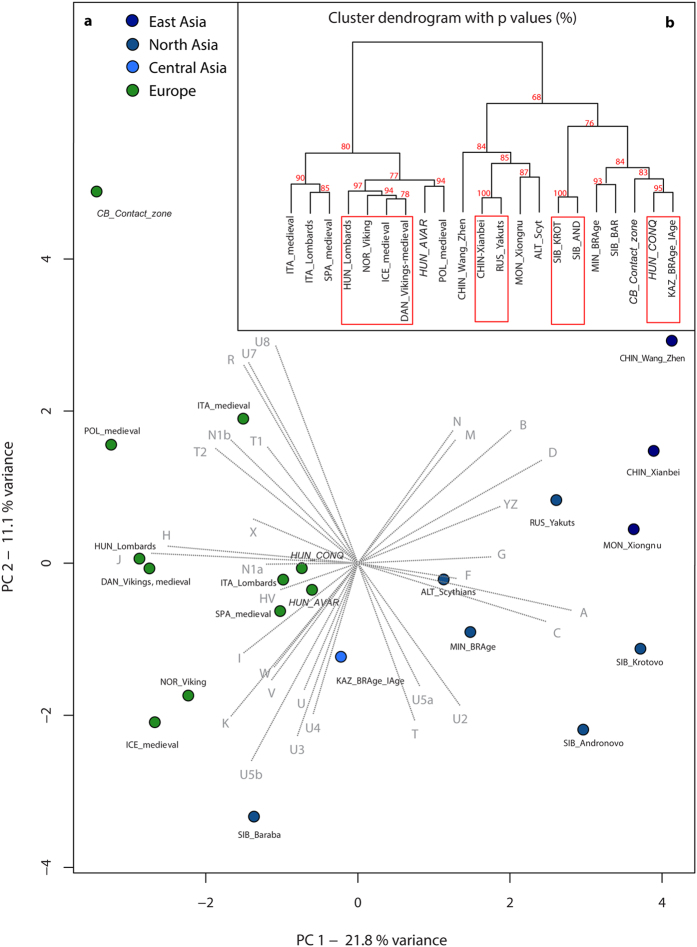
Figure 3.
(a) PCA plot of the first two components (32.9% of variance), comparing haplogroup frequencies of 21 ancient populations. (b) Ward type hierarchical clustering of 21 ancient populations. On the PCA plot the contribution of each mtDNA haplogroup is superimposed as grey component loading vector. PCA of 21 ancient populations shows a predominant difference between European and Asian populations along PC1 (variance = 21.8%), which furthermore shows a clustering of the medieval populations of Europe, as well as the assembly of Avars (HUN_AVAR), conquerors (HUN_CONQ), and other Mediterranean populations. Along the PC2 component (variance = 11.1%), the most distant population within the European sector is of the contact zone in the Carpathian Basin (CB_Contact_zones). Prehistoric Central Asian (Kazakhstan), south western Siberian (Baraba Late Bronze Age culture), and south central Siberian populations (abbreviations: KAZ_BRAge_IAge; SIB_BAR, MIN_BRAge) show similarities to the conquest-period datasets both on PCA (a) and the Ward clustering tree (b). P values in percent are given as red numbers on the dendogram, where red rectangles indicate clusters with significant p-values. The abbreviations and references are presented in Supplementary Table S5.

