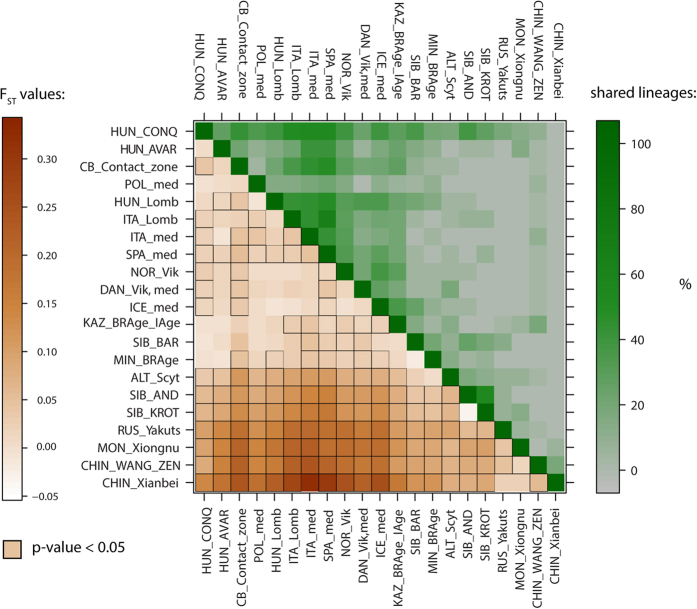
Figure 5. FST level plot and shared haplotype analysis with 21 ancient populations.
Lower left corner: larger pairwise FST values indicating greater genetic distances are marked by dark brown shades. Significant p-values are highlighted with black squares. Upper right corner: high percentages of shared lineages are highlighted with dark shades of green color. For exact values, abbreviations and references, see Supplementary Tables S8 and S10.

