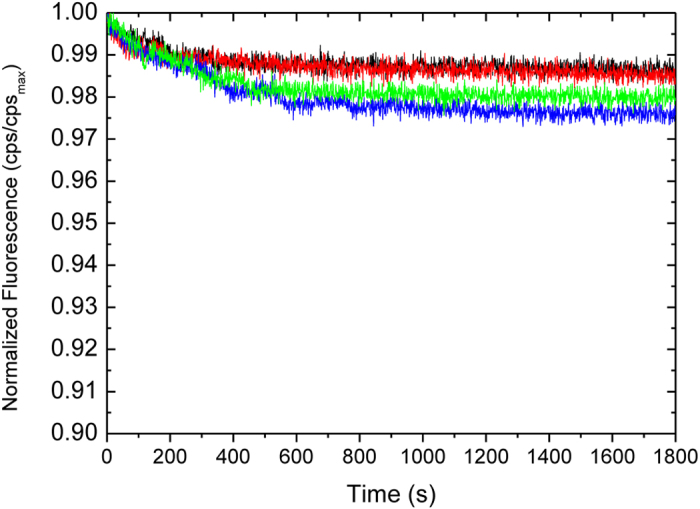
Figure 2.

Copper(II)-catalyzed ROS formation monitored in 25 mM Tris buffer, pH 7.6 by fluorescence intensity decrease as a function of time for: 5 μM Cu(II) (red line); hCP 2 nM, 5 μM Cu(II) and 29 μM DTT (black curve); 29 μM DTT (green curve); 5 μM Cu(II) and 29 μM DTT (blue curve). Due to the presence of 1 mM DTT in all commercial stock solutions of hCP, control experiments at 29 μM DTT were performed to mimick the effect of Cu(II)/DTT in a hCP-free solution.
