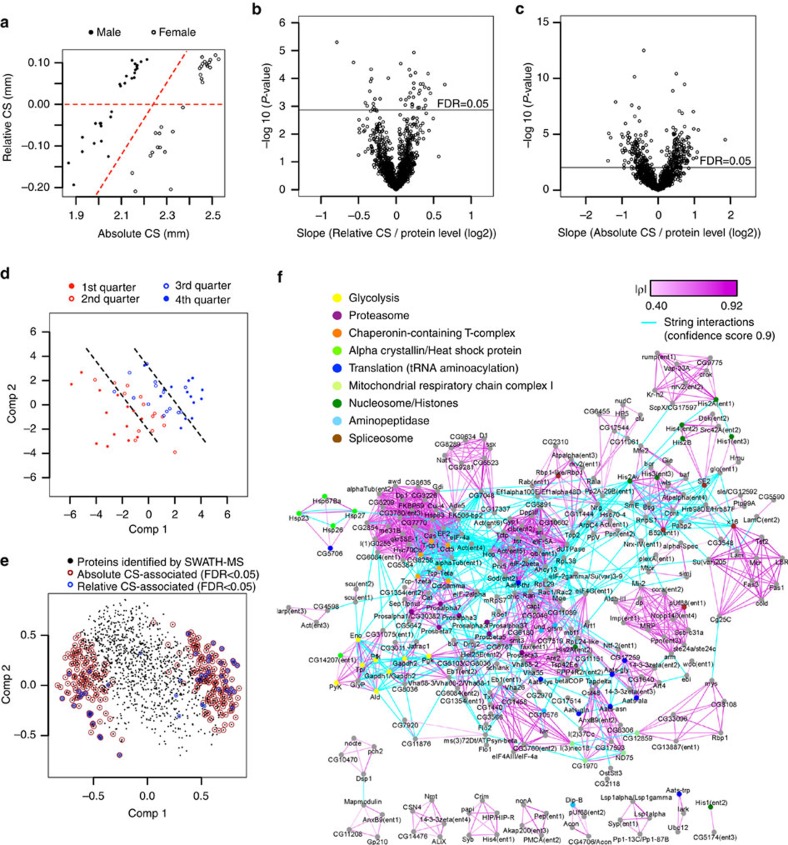
Figure 2. Protein network of wing-size-associated proteins.
(a) CS of wings at adult age. Absolute CS and relative CS (adjusted for body size) were used as explanatory variables in PWAS. (b,c) Association of proteins with relative and absolute CSs, respectively. P-values are plotted against the slope of the fitted line. The horizontal line indicates 5% FDR threshold. (d) Score plot against the first two PLS components. Samples sorted by wing size into four groups are aligned along the components in an increasing manner. (e) Correlation loadings plot. Correlation between proteins and the PLS components are plotted. The wing-size-associated proteins are marked as indicated. (f) Protein network and functionality of the wing-size-associated proteins. Protein covariation modules were identified based on absolute Spearman's correlation (|ρ|>0.4, equivalent to P-value <0.001). Strength of connection is indicated by the tone of purple colour. Protein interactions (cyan edges) based on STRING database at the highest confidence (Score=0.9) were combined to construct a large wing-size-associated protein network. Enriched functionalities identified by David are indicated by node colours as indicated.

