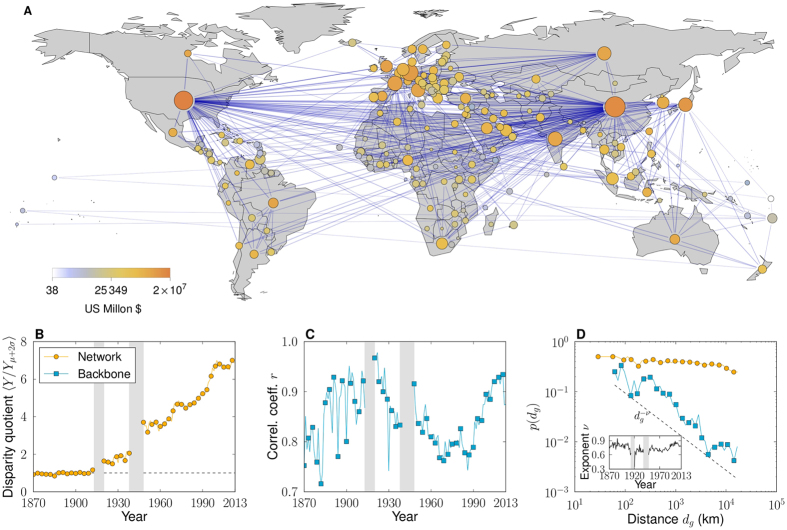
Figure 1. Backbones of International Trade.
(A) Backbone for the year 2013. Nodes represent countries and their sizes are proportional to the logarithm of the number of trade partners in the backbone. Nodes are colored according to the logarithm of GDP values. Map created with Mathematica, Version 9, https://www.wolfram.com/mathematica/ ref. 52. (B) Evolution of the local heterogeneity level. (C) Pearson correlation coefficient, r, between the GDPs of countries and their degrees in the backbone. In the unfiltered network, values of r are in the range r ≈ 0.3–0.4 after WWII. (D) Probability of trade as a function of geographic distance for the year 2013. It follows a power law, p(d) ~ d−ν, with ν ≈ 0.7 in the backbones; whereas it is almost independent of distance in the unfiltered networks.

