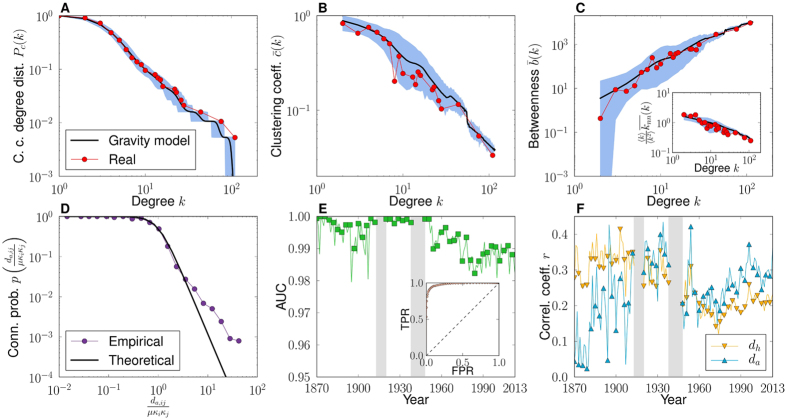
Figure 3. Quality of the embedding.
(A–C) Comparison of the topology of the world trade backbone in 2013 with 1000 synthetic networks generated by the gravity model of trade channels using the coordinates of the corresponding embedding. Complementary cumulative degree distribution (A), degree-dependent clustering coefficient (B), country betweenness centrality (C), and average nearest-neighbor degree (inset (C)). The thick black line gives the average over realizations and the error bars mark the 99% confidence interval. (D) The empirical connection probability as a function of effective distance rescaled by economic sizes, measured using the coordinates of the embedding for the year 2013. The empirical probability is compared to Eq. (1). (E) The temporal evolution of the area under the ROC curve or AUC statistic. The inset shows the ROC curve of the model in 2013. (F) The historical evolution of the Pearson correlation coefficient between hyperbolic and angular distances, dh and da, and geographical distance dg.

