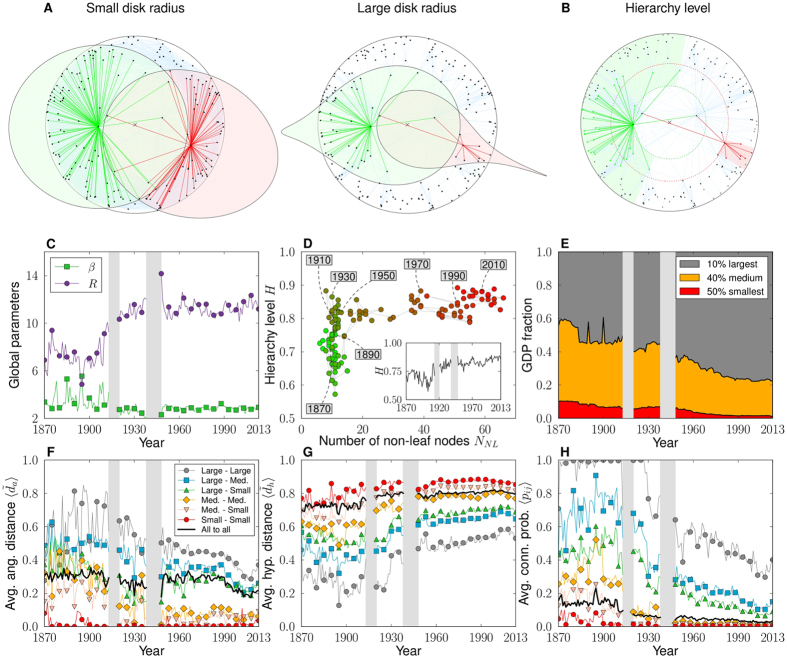
Figure 4. Hierarchy in World Trade Maps.
(A) Two hyperbolic disks with different radii (rescaled). Within each disk, we draw two circles of the same radius but centered at different locations. For small radius, the two inner circles appear to be close to Euclidean disks; whereas for large radius, the inner circles are strongly distorted. (B) Sketch illustrating the definition of the hierarchy level, H, of two different nodes. Leaf nodes appear in gray. (C) Evolution of the radius, R, of the hyperbolic disk and of the elasticity parameter, β. (D) Evolution of the hierarchy level, H, as a function of the number of non-leaf countries and of time (inset). Note that the number of non-leaf countries has grown (with some fluctuations) over time, so that the increase of NNL along the x-axis is roughly chronological. (E) Evolution of the fraction of total GDP accumulated by the top 10%, 40%, and 50% of countries by economic size. (F–H) Evolution of the average normalized angular distance (only connected countries), the average normalized hyperbolic distance, and the average connection probability, between countries within the same group and in the different groups defined in (E).

