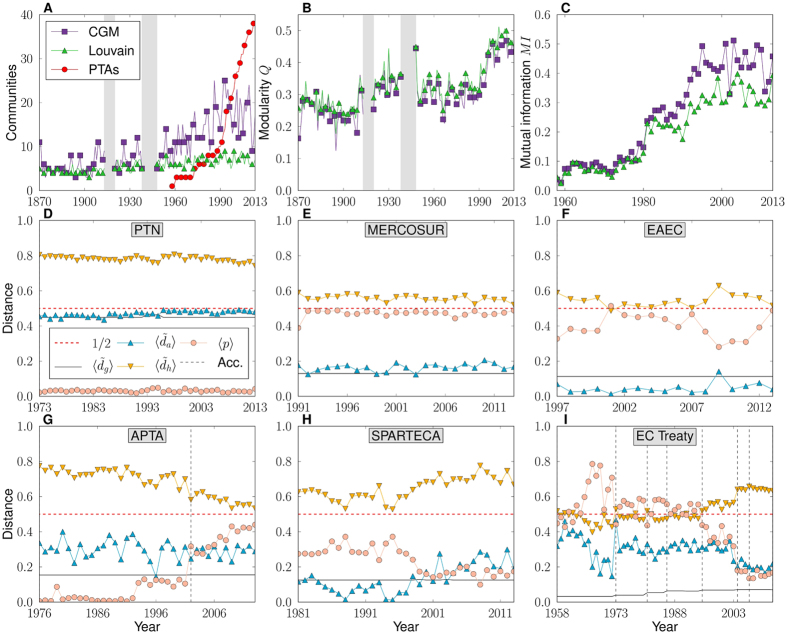
Figure 5.
Natural Communities vs. Preferential Trade Agreements. (A) Evolution of the number of communities found by the Louvain method and the critical gap method, along with the evolution of the number of PTAs. (B) Evolution of the modularity, Q, for the two methods. (C) Mutual information between critical gap method or Louvain communities and PTAs. (D–I) Evolution of normalized angular and hyperbolic distances between countries in representative PTAs, along with the average geographic distance and the average connection probability within each PTA. Dashed vertical lines indicate the accession of new countries. The dashed horizontal red line indicates the 0.5 level, which, in the case of angular distances, corresponds to a random distribution of points.

