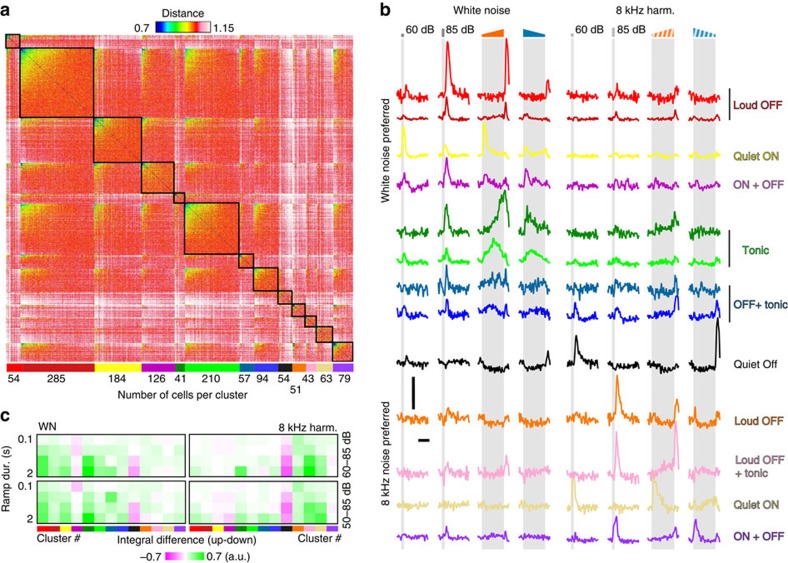
Figure 4. Clustering of single neuron population responses.
(a) Distance matrix for the 1,341 clustered neurons. The metric used is d=1−cc, where cc stands for the Pearson correlation coefficient between response traces. The identified clusters are delineated by a black square and labelled at the bottom of the matrix by a coloured bar under which the number of cells in the cluster is indicated. Within each cluster the cells are sorted according to their mean distance with all other cells of the matrix. The gradient of distances within each cluster reflects the heterogeneity of the signal-to-noise ratio across cells. More reliable cells are on the left, less reliable cells on the right. (b) Mean response profiles of the 12 identified clusters to four white noise and 8 kHz harmonic sounds (60 and 85 dB 0.25 s duration and 60–85 dB 2 s duration up- and down-ramps). Scale bars, vertical 4% ΔF/F, horizontal 1 s. (c) Average absolute integral differences between up- and down-ramps for each cluster, ramp intensity ranges and durations.

