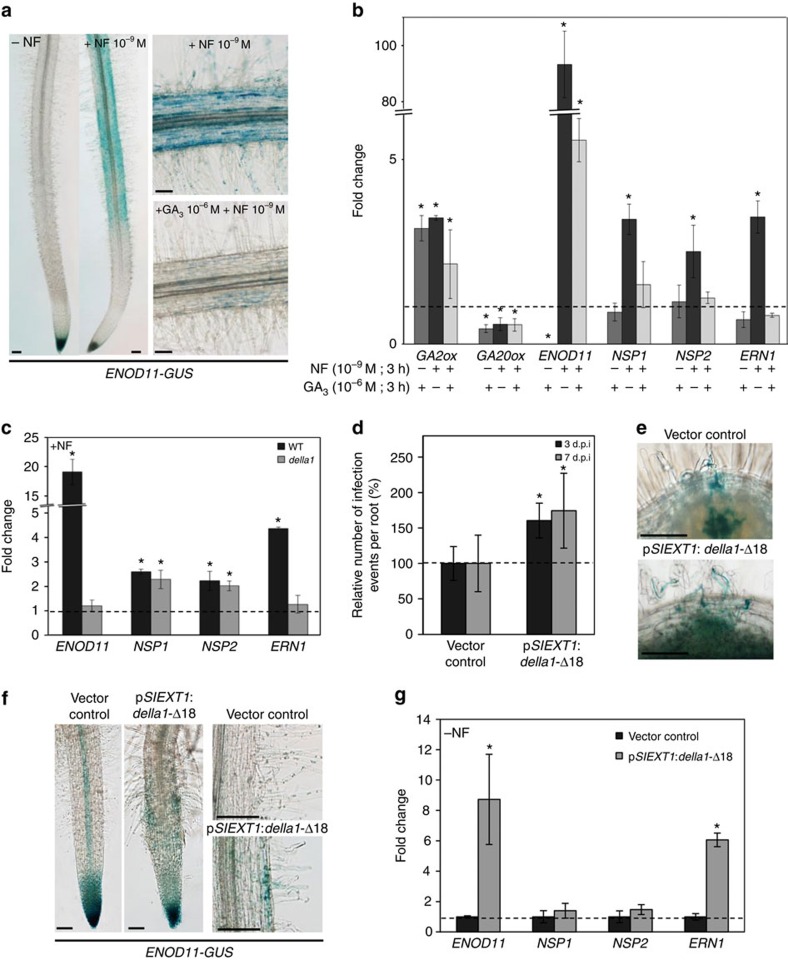
Figure 5. Gibberellins regulate rhizobial infection and ENOD11 expression depending on MtDELLA1 activity in the epidermis.
(a) Histochemical localization of GUS activity in 7-day- old transgenic seedlings expressing the rhizobial infection marker pENOD11:GUS after a NF (10−9M) treatment and with or without a GA3 (1 μM) pre-treatment. (b) Expression of GA2ox, GA20ox, NSP1, NSP2, ERN1 and ENOD11 in WT roots after a NF (10−9M) treatment, and with or without a GA3 (1 μM) pre-treatment. (c) Expression of the ENOD11 infection marker and of NSP1, NSP2 and ERN1 after a NF (10−8M) treatment in the WT and in della1 mutant roots. (d) Relative number of infection events in pSlEXT1:della1-Δ18 roots, at 3 and 7 days post inoculation with S. meliloti (strain 2011) expressing the LACZ reporter. Results are shown as percentages relatively to the empty vector control. (e) Representative images of infection threads visualized by staining of S. meliloti (strain 2011) expressing the LACZ reporter in roots transformed with the vector control (top) or the pSlEXT1:della1-Δ18 (bottom) construct. (f) Histochemical localization of GUS activity in transgenic roots expressing pENOD11:GUS, transformed with the empty vector control or the pSlEXT1:della1-Δ18 construct. Details of root hairs are shown in right panels. (g) Expression of ENOD11, NSP1, NSP2 and ERN1 in non-inoculated roots expressing pSlEXT1:della1-Δ18 or the vector control. In b,c and g, transcript levels are normalized relatively to untreated control roots to show fold changes and the dotted line indicates a ratio of 1. In d, results are shown as percentages relatively to the empty vector control and dotted line indicates a ratio of 100%. Error bars represent s.d. in b,c and g, and confidence intervals (α=0.05, n>15 plants per condition) for d. In all cases, the asterisks indicate significant difference compared with the control based on a Mann–Whitney test (α<0.05). One representative example out of two biological replicates is shown. Scale bars, 100 μm (a,e).

