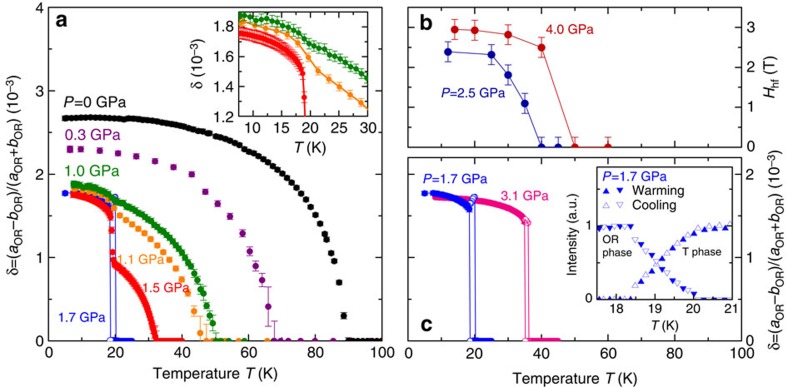
Figure 2. Structural and magnetic order parameters of FeSe under pressure.
(a,c) Plot the orthorhombicity,  , as a function of temperature at various pressures. Error bars indicate 2σ, the fitting error. The inset in a, shows a magnified view of the data close to the discontinuous change in δ near 19 K. A coexistence region for the orthorhombic and tetragonal phases is observed at pressures P=1.7 and 3.1 GPa as indicated by open symbols and vertical lines. The inset of c, shows the relative integrated intensities of the tetragonal (T) and orthorhombic (OR) phases on warming and cooling respectively, at P=1.7 GPa. Any thermal hysteresis is smaller than the point spacing (0.2 K), whereas the coexistence temperature region spans 1.5 K. (b) Displays the magnetic hyperfine field Hhf derived from CONUSS fits37 of the NFS data in Figs 1c,d. The error bars were estimated from fits to the data in the paramagnetic phase and include a 2% fitting error.

