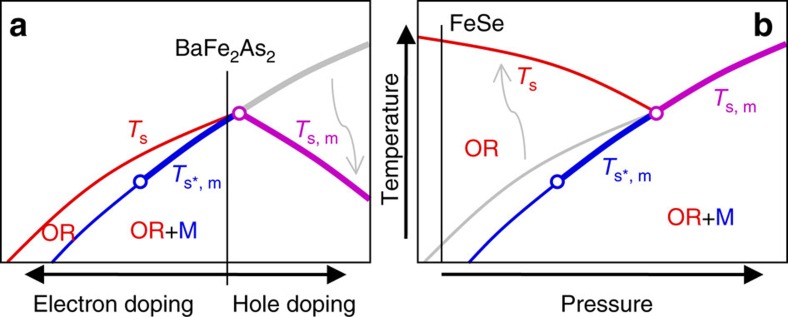
Figure 4. Evolution of the character of the magnetic and nematic transitions in the spin-driven nematic theory.
For both panels the blue lines represent magnetic transitions, the red lines denote structural transitions and the violet lines represents the joint magneto-structural transition. The grey lines show the trends noted in the spin-driven nematic theory5 which differ from those found in experiments. Thick lines denote first-order transitions, whereas the thinner lines denote second-order transitions. For a, the control parameter is partial element substitution (doping) for the case of BaFe2As2. For b, the control parameter is pressure for the case of FeSe. Ts, Ts*,m and Ts,m denote the structural transition temperature, the magnetic ordering temperature associated with the discontinuous change in the orthorhombicity, and the joint structural and magnetic transition temperature, respectively.

