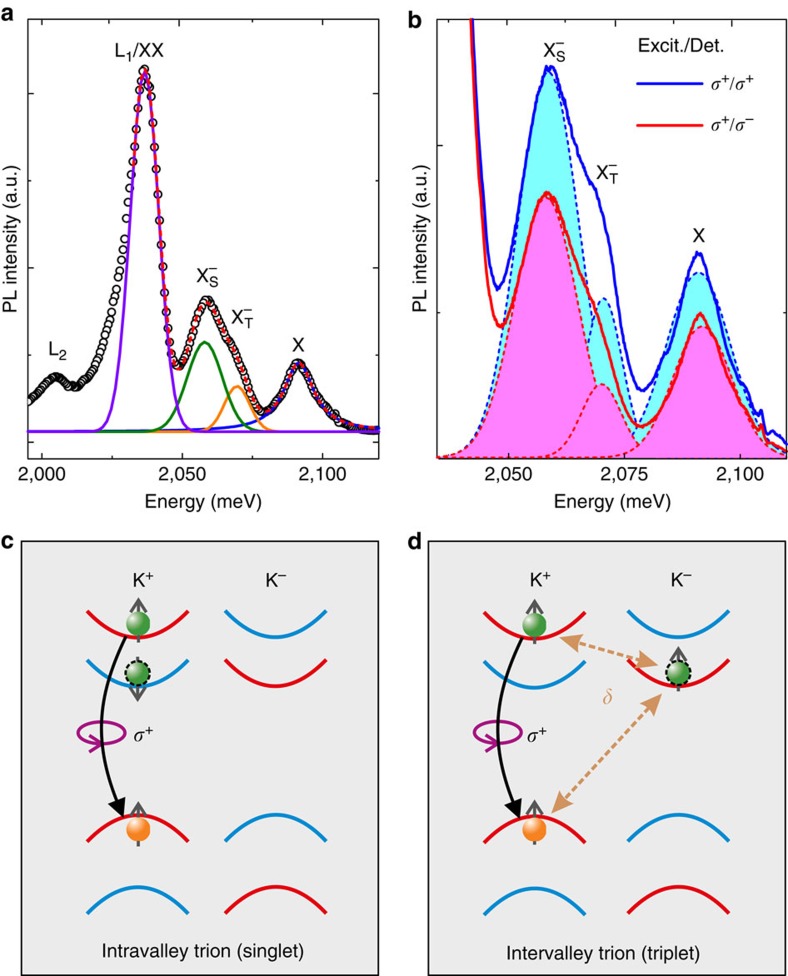
Figure 1. Trion fine structure and valley polarization observed in low-temperature PL.
(a) PL spectrum of monolayer WS2 at a temperature of 4 K. The black circles represent the data, the red curve is the sum of the fit functions for neutral A excitons X (blue), the peaks we associate with triplet  (orange) and singlet trions
  (green), and the biexciton/localized exciton complex XX/L1 (violet). In addition, a second localized exciton peak L2 at lower energies is visible. (b) Helicity-resolved PL spectra of the same flake as depicted in (a). The solid blue (red) lines represent the data for co-(contra-)circular excitation (Excit.) and detection (Det.), the dashed lines in corresponding colours are fit functions for X,
  and
and  . Circular polarization degrees of the different excitonic features are calculated by evaluating the areas under the corresponding fit curves. (c,d) Schematic illustration of singlet (c) and triplet (d) trion configurations for WS2 in the K+ valley. Electrons in the conduction (valence) band are represented by green (orange) spheres. Spin-up (-down) bands appear in red (blue) colour. The curved arrows indicate the interband recombination. The final state of the remaining conduction-band electron after trion recombination is marked by the dashed black outline. The intervalley electron–hole exchange interaction leading to an energetic splitting δ is indicated by the dashed arrows.

