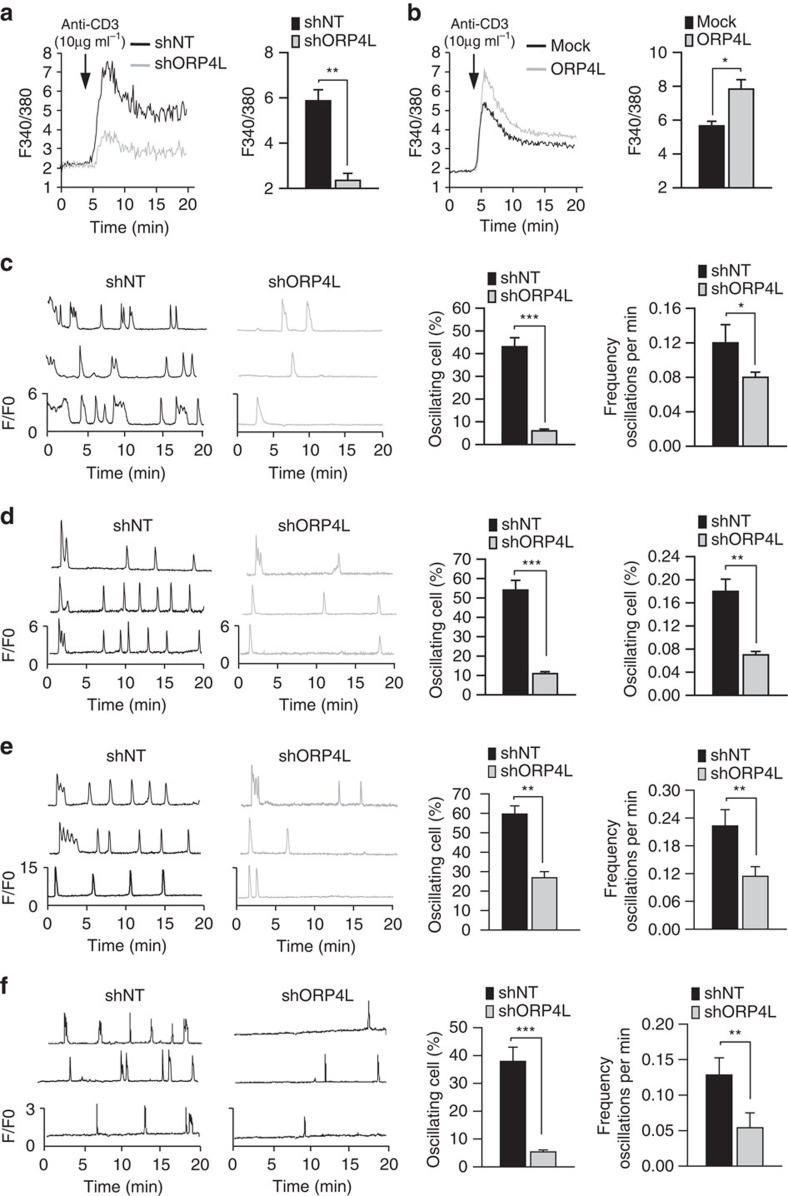
Figure 4. ORP4L modulates Ca2+ signalling in T-ALL cells.
(a,b) Jurkat T-cells subjected to ORP4L knockdown (a) or overexpression (b) were stimulated with 10 μg ml−1 anti-CD3. Changes in [Ca2+]i were recorded as the F340/380 ratio using Fura-2 AM. Average [Ca2+]i responses and quantification of [Ca2+]i peak amplitudes are shown. (c–e) Spontaneous [Ca2+]i oscillations in Jurkat T-cells (c), Molt-4 cells (d) and primary T-ALL cells (e) with ORP4L knockdown. Changes in [Ca2+]i were recorded as F/F0 ratio using Fluo-4-AM in confocal Ca2+ imaging. Spontaneous [Ca2+]i oscillations in three representative cells (left) were measured, and the difference in frequency and number of oscillating cells is shown (right). (f) Spontaneous [Ca2+]m oscillations in Jurkat T-cells with ORP4L knockdown. Changes in [Ca2+]m were recorded as F/F0 ratio using Rhod-2-AM in confocal Ca2+ imaging. For the Jurkat T-cells the data represent mean±s.d. value from an experiment performed in triplicate, and for primary T-ALL cells the mean±s.d. value of n=3 primary T-ALL specimens. *P<0.05, **P<0.01, ***P<0.001, Student's t test.

