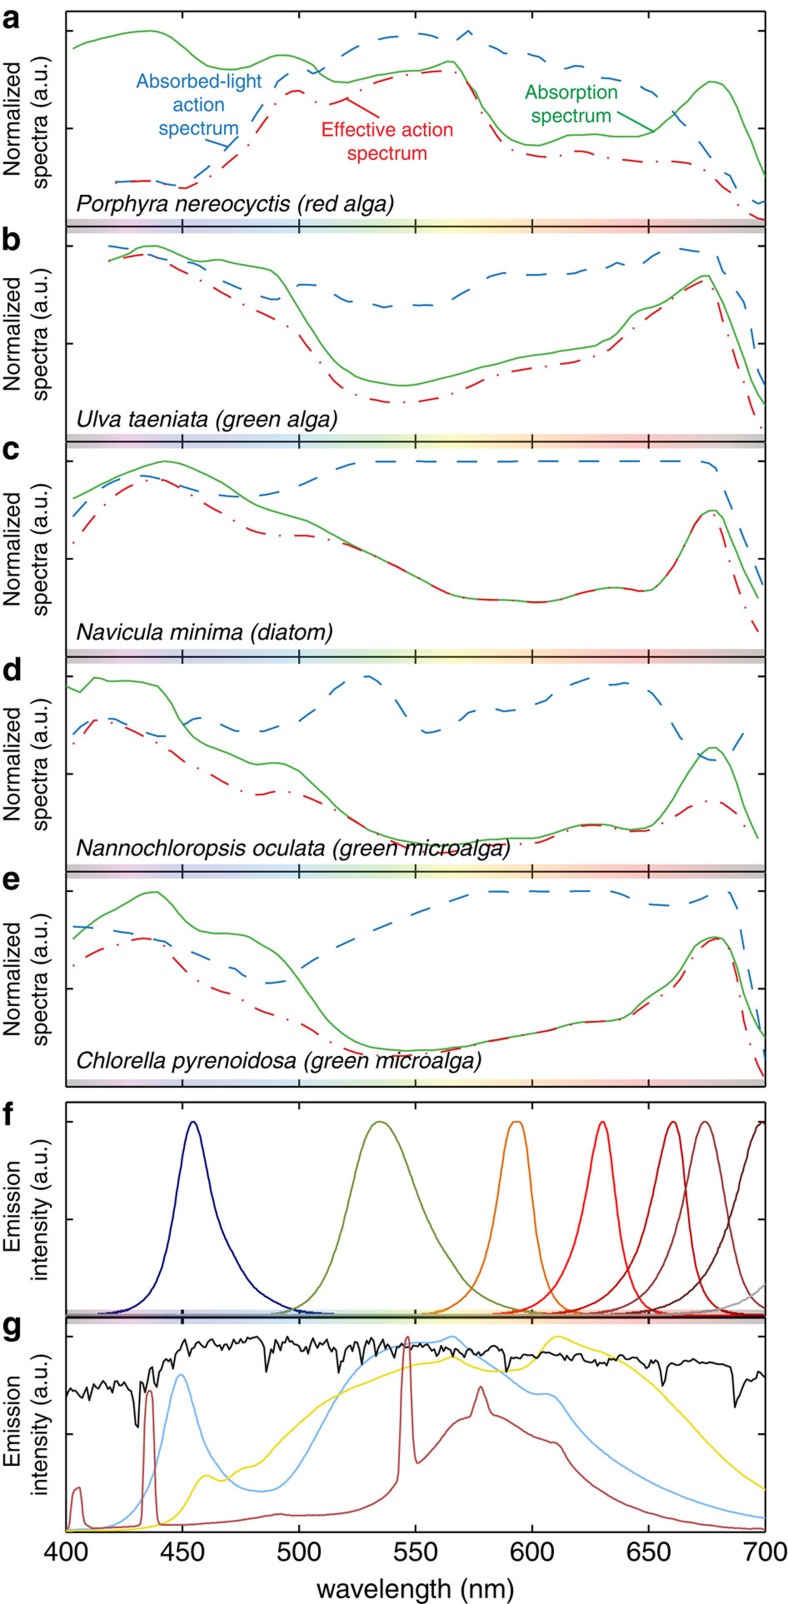
Figure 3. Light absorption and emission.
(a–e) Normalized absorption spectra (green solid lines), absorbed-light action spectra based on measured oxygen evolution (blue dashed lines), and the combined effective action spectra (red dash-dot line) determined as the product of the absorption and absorbed-light action spectra for macroalgae and microalgae. (f) Emission spectrum of typical monochromatic and (g) white light emitters with sunlight (black solid line) included as a reference. While different qualities of white light can be produced using, for example, cool white LEDs (blue solid line), warm white LEDs (yellow solid line) or fluorescent bulbs (red solid line), the spectra emitted from these light sources are drastically different from the light emitted by the sun, and will consequently induce different responses from photosynthetic organisms. Action and absorption adapted from (a,b) ref. 29, Copyright 1950 Rockefeller University Press, (c) ref. 99, (d) ref. 31 with permission from Elsevier, (e) ref. 100 and (f,g) emission spectra as measured by the authors, solar spectrum from AM1.5.

