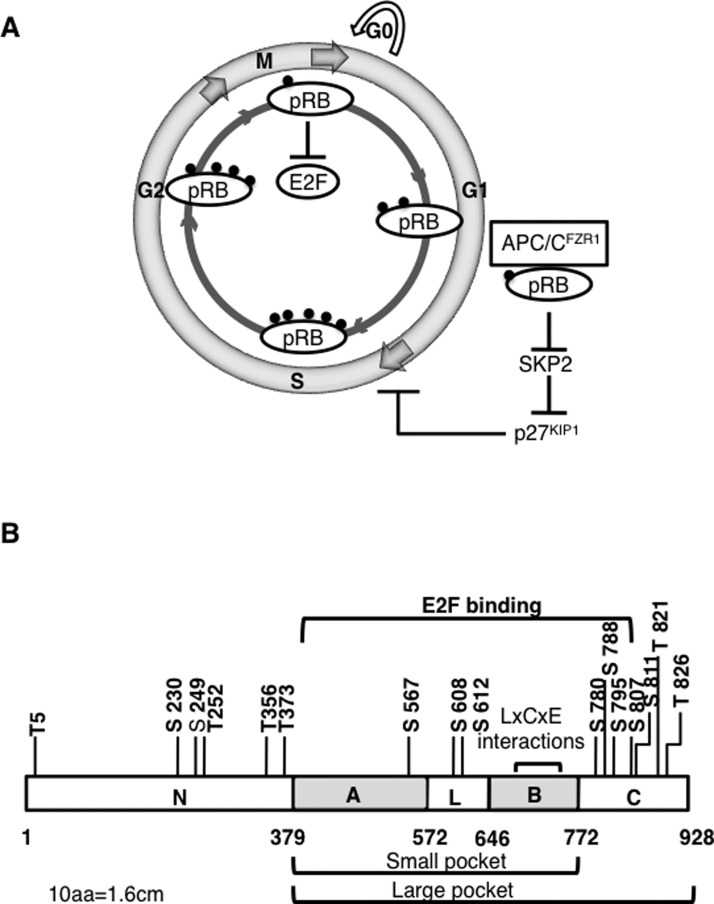
Figure 2. Different mechanisms of G1-S regulation by pRB.
Transcriptional and post-translational regulation of G1-S transition by pRB-E2F and pRB-APC/CFZR1 complexes. The phosphorylation status of pRB is indicated by black solid balls, with numbers of balls reflecting hypo- or hyper phosphorylation of pRB (not actual number of phosphorylation sites) (A). Domain organization of pRB showing phosphorylation sites and regions of interactions with various cellular proteins. Numbers show amino acid positions (B).

