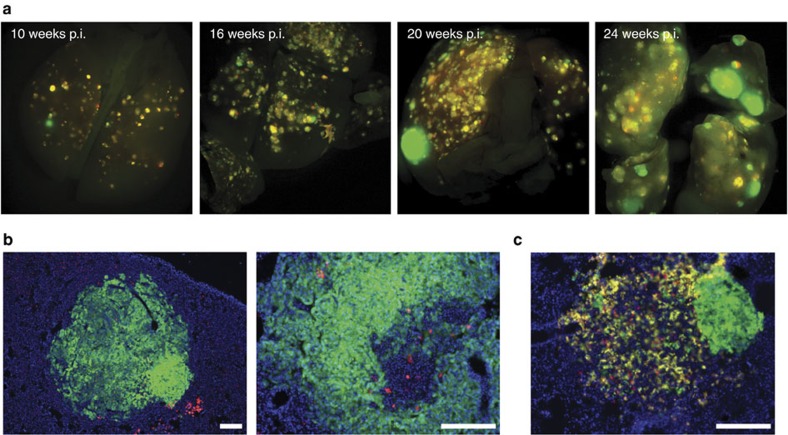
Figure 2. p53 constrains lung tumour progression in the LSL-KrasG12D-MADM model.
(a) Whole-mount images of K-MADM-p53 mice at various time points following lentiviral Cre administration displaying p53KO/KO (green, GFP+/tdTomato-), p53WT/WT (red, GFP-/tdTomato+) and p53KO/WT (yellow, GFP+/tdTomato+) cells within lung tumours. p.i., post infection. (b) Lung adenocarcinomas consisting mostly of green cells. (c) Mixed-grade tumour consisting of adenoma (left) and adenocarcinoma cells (right). The adenocarcinoma component consists of all green cells. Blue, DAPI-stained nuclei. Scale bars, 200 μm (all).

