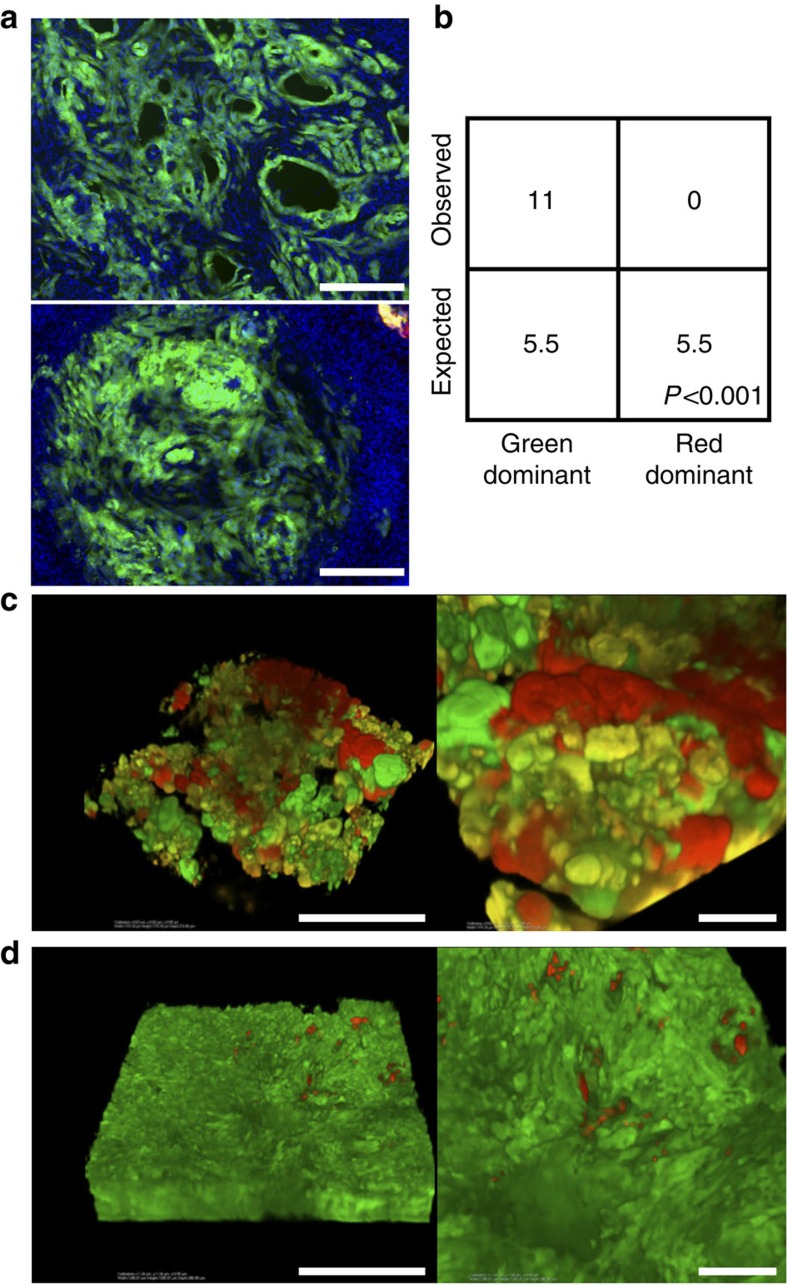
Figure 6. p53 constrains pancreatic tumour progression in Pdx1-Cre-K-MADM-p53 mice.
(a) Representative images of high-grade PanIN and PDAC from 6-week-old Pdx1-Cre-K-MADM-p53 mice show uniform green (GFP+/tdTomato−, p53KO/KO) labelling in these advanced lesions. Blue, DAPI-stained nuclei. Scale bars, 100 μm. (b) Absolute quantification of high-grade PanINs/PDAC in 6-week-old Pdx1-Cre-K-MADM-p53 mice (n=5 mice total). Expected numbers are based on 1:1 stoichiometric ratio of green and red cell generation, and were not observed (P<0.001, χ2-test). (c) CLARITY image of pancreas from a 13-week-old Pdx1-Cre-K-MADM-p53 mouse showing grossly diseased pancreas (PanINs interspersed with normal pancreatic tissue) without overt PDAC. Right image shows zoomed in area from left image. Scale bars, 1 mm (left image) and 100 μm (right image). (d) CLARITY image of PDAC from a 13-week-old Pdx1-Cre-K-MADM-p53 mouse. Right image shows zoomed in area from left image. Scale bars, 1 mm (left image) and 100 μm (right image).

