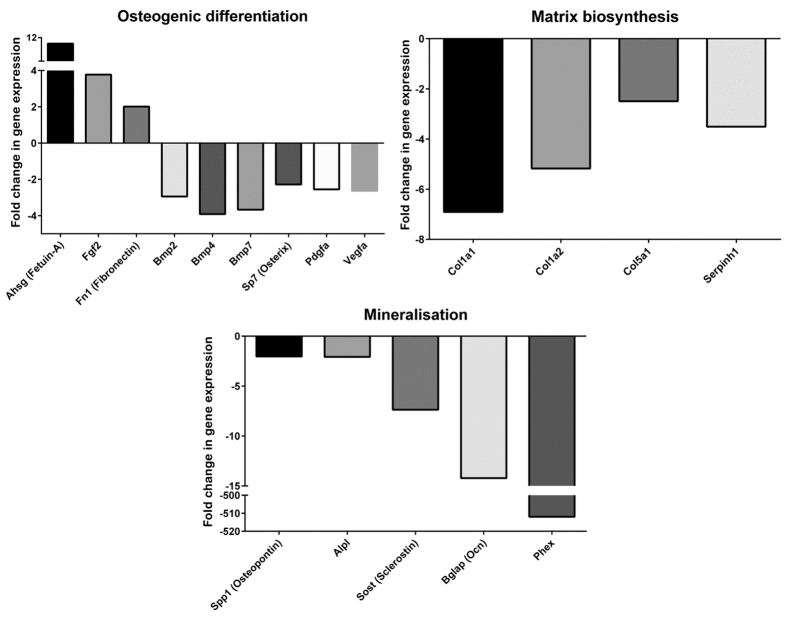
Figure 2. Fold changes in the expression of candidate genes from the mouse osteogenesis RT2 Profiler™ PCR array in day-28 osteogenic cultures of BMSCs of 14-week-old Bag-1+/− female mice relative to day-28 osteogenic cultures of BMSCs of age-matched Bag-1+/+ female mice.
Fold changes in the expression of genes crucial for osteogenic differentiation, bone matrix synthesis and mineralization were plotted in the form of bar graphs. The PCR arrays were performed in triplicate and the results were analysed using RT2Profiler PCR array data analysis version 3.5. The threshold for the fold–change in gene expression was set at 2 and the significance of the difference in gene expression was calculated with the P-value set at 0.05.

