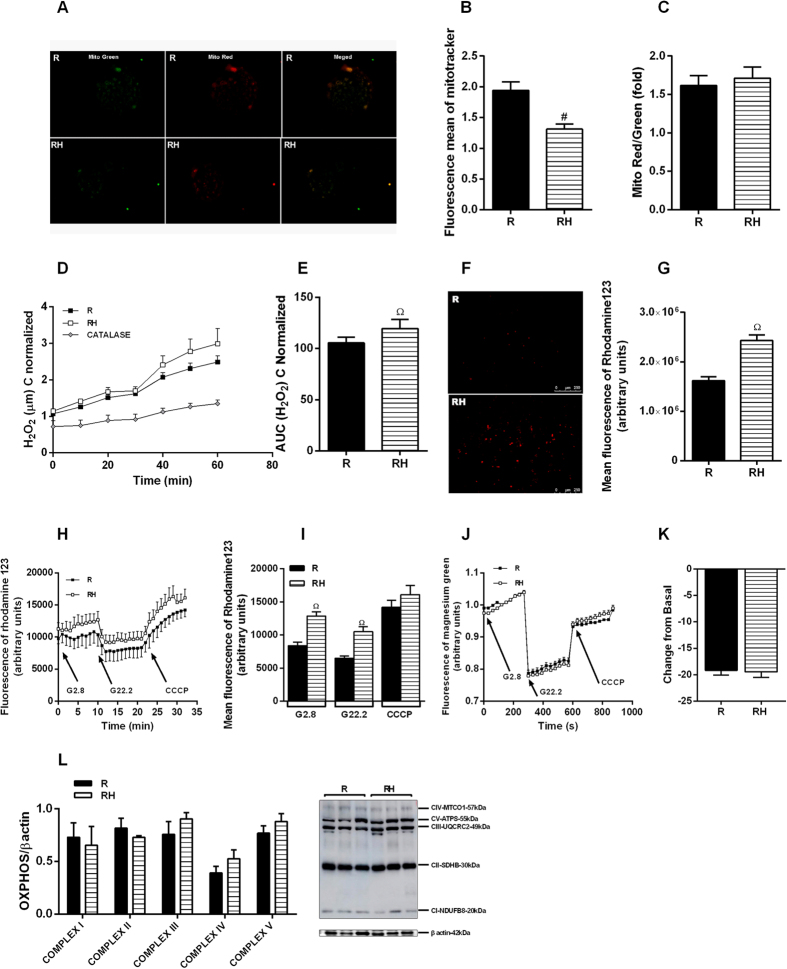
Figure 3.
Islets from malnourished obese mice present increasing of mitochondrial profile: MitoTracker Red/Green staining of mitochondria in islets (A). Quantification of Mitotracker Red/Green ratio (B,C). H2O2 production (D,E). Indirect measure of mitochondria potential membrane from dissociated cells at baseline (F,G) or pancreatic islets incubated with rhodamine 123 in response to glucose (H,I). ATP flow showing by changes in magnesium green AM fluorescence in response to glucose (J,K). Protein content for OXPHOS (L). Results are means ± SEM (n = 4–9) (p < 0.05) ΩR, in ANOVA Newman Keuls´s post-test.

