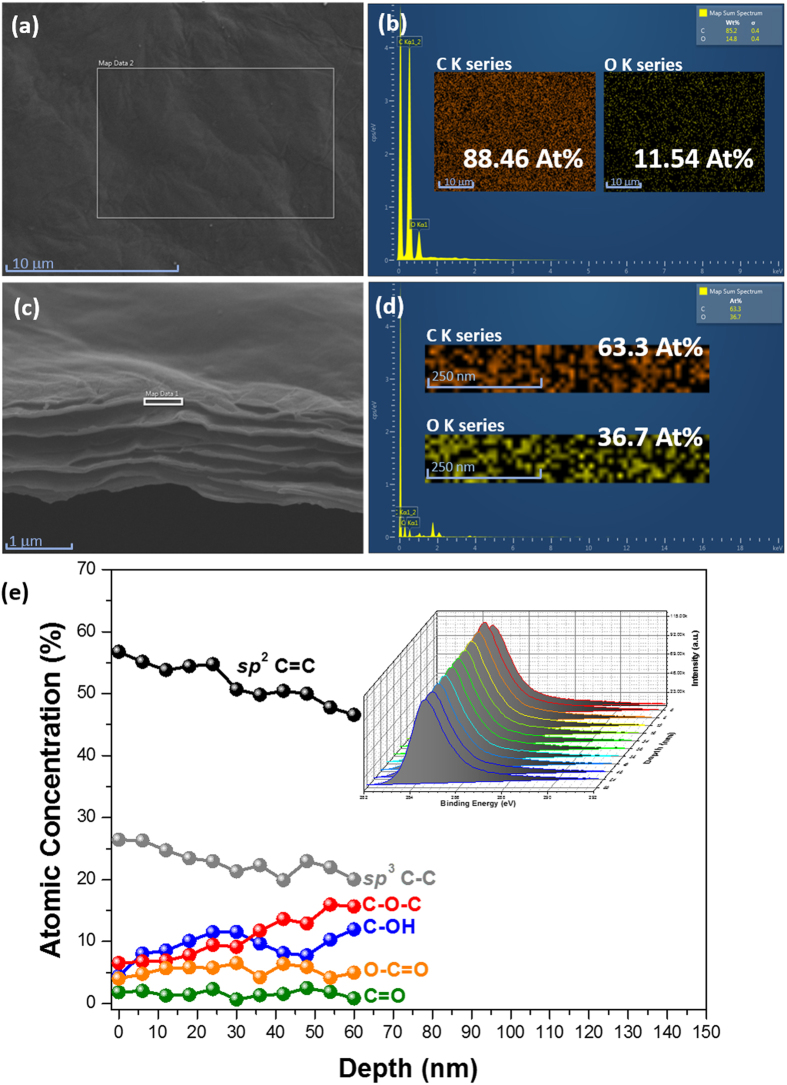
Figure 7.
SEM image of (a) the surface image of the TrGOF, EDX spectrum (b) and corresponding element mapping (inset b). SEM image (c) of the cross section of TrGOF, EDX spectrum (d) and corresponding distribution of element (inset d). (e) Concentration depth profile of C 1s in the TrGOF using a monochromatic X-ray source and an argon ion-beam. Inset: the set of C 1s spectra measured during a depth profiling experiment.

