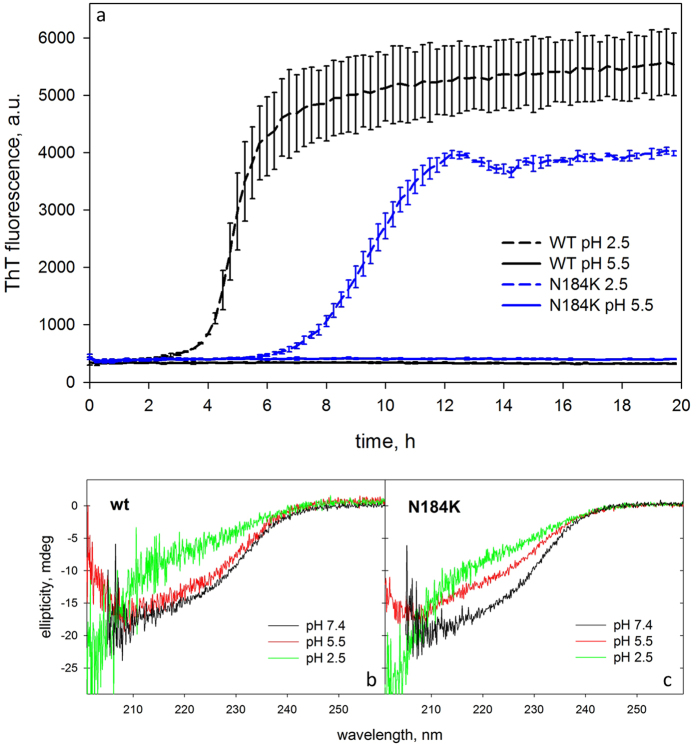
Figure 3. N184K mutation does not increase G2 inherent propensity to form fibrils.
(a) Aggregation kinetics monitored by the increase of ThT fluorescence of wt (black traces) and N184K (blue traces) G2l variants at both pH 2.5 (dashed lines)and 5.5 (solid lines). (b,c) CD spectra of wt (left panel) and N184K mutant (right panel) G2l in the fibrillogenesis conditions compared to the spectrum at physiological pH.

