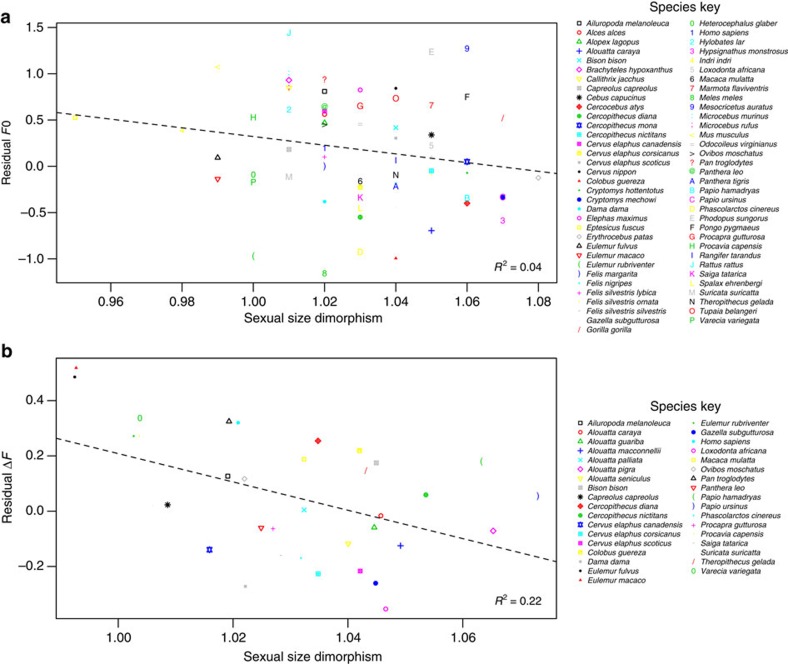
Figure 2. Relationship between sexual size dimorphism and acoustic variables across terrestrial mammal species.
The scatterplots show the relationship between (a) sexual size dimorphism and residual F0, and (b) sexual size dimorphism and residual ΔF. Residual F0 and ΔF refer to the residuals obtained from PGLS regressions of log10 male body mass on log10 F0 and log10 male body mass and habitat on log10 ΔF, respectively. For each plot, the dotted line represents the slope and intercept of the PGLS model regressions (plot A: N=67, P=0.119; plot B: N=35, P=0.006). R2 values are given in the bottom right-hand corner.

