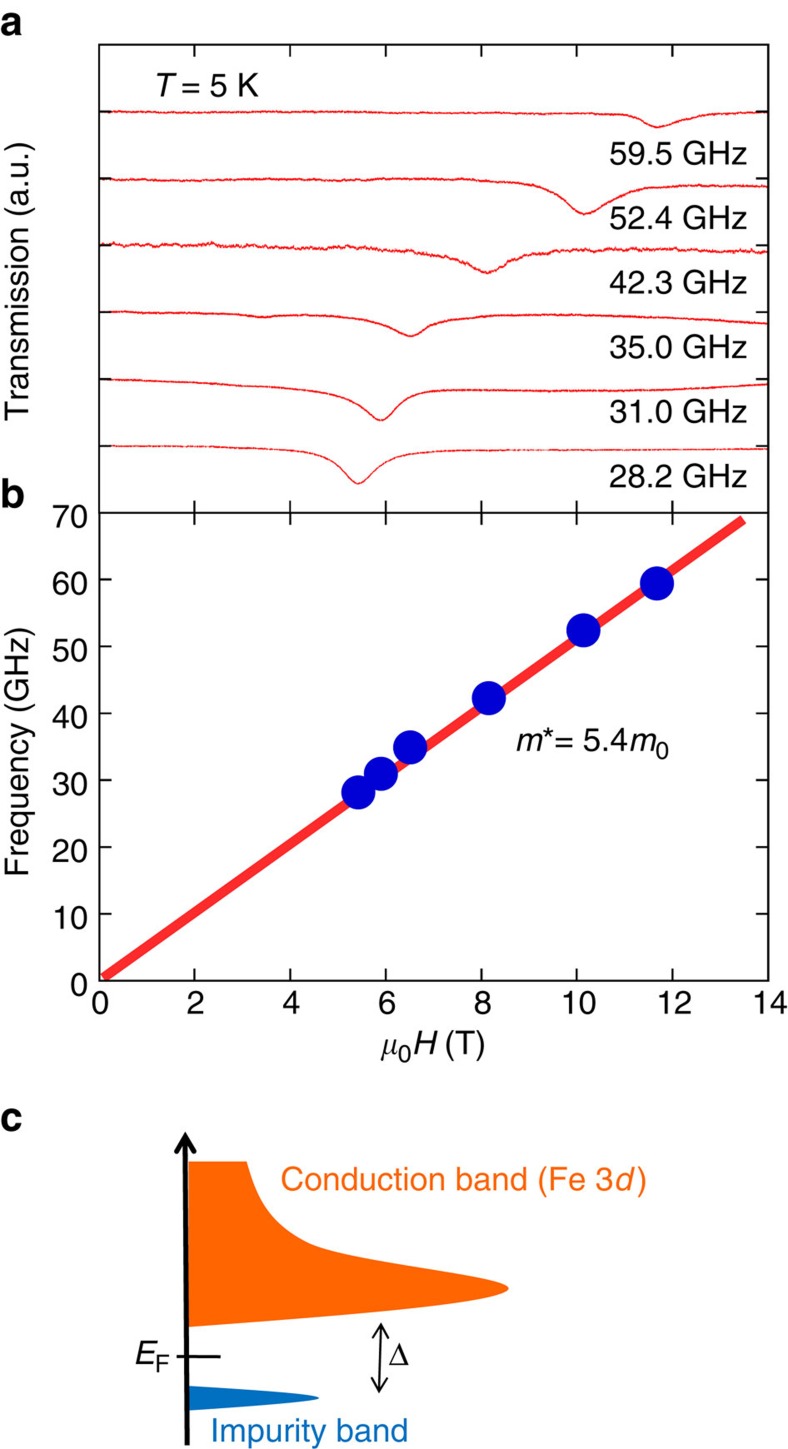
Figure 4. CR measurement.
(a) CR spectra at 5 K at the designated frequencies. (b) Frequency versus magnetic field plot of the CR fields obtained from the data in a. Straight line gives a cyclotron effective mass m* of 5.4m0 (where m0 is the bare electron mass). (c) Band diagram of FeSb2; a small energy gap Δ appears between the conduction and impurity bands15,18,27. The conduction band may possess a steep band edge associated with the localized Fe 3d orbitals, leading to the large electron mass.

