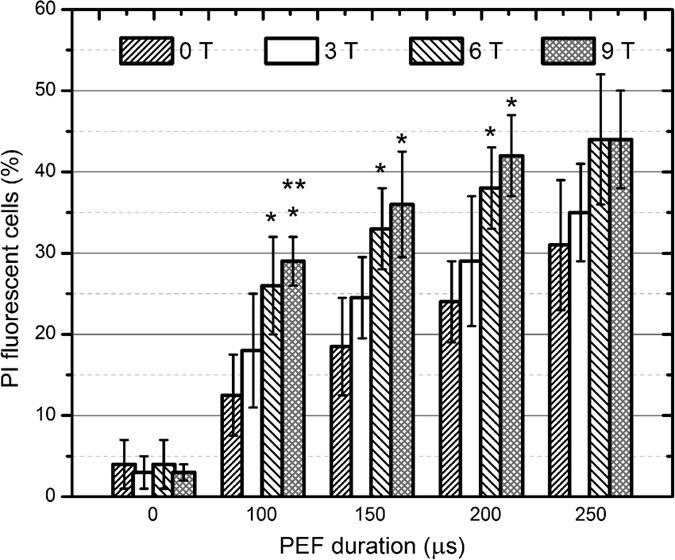
Figure 2. Dependence of the percentage of PI fluorescent S. cerevisiae cells on the treatment parameters.

The label (*) represents statistically significant difference (P < 0.05) between the PEF only treatment and the samples after the PEF + PMF procedures in each instance. The label (**) highlights statistically significant difference (P < 0.05) between the PEF + 3 T and the 6, 9 T PEF + PMF instances. The t-test has been used for the statistical significance determination.
