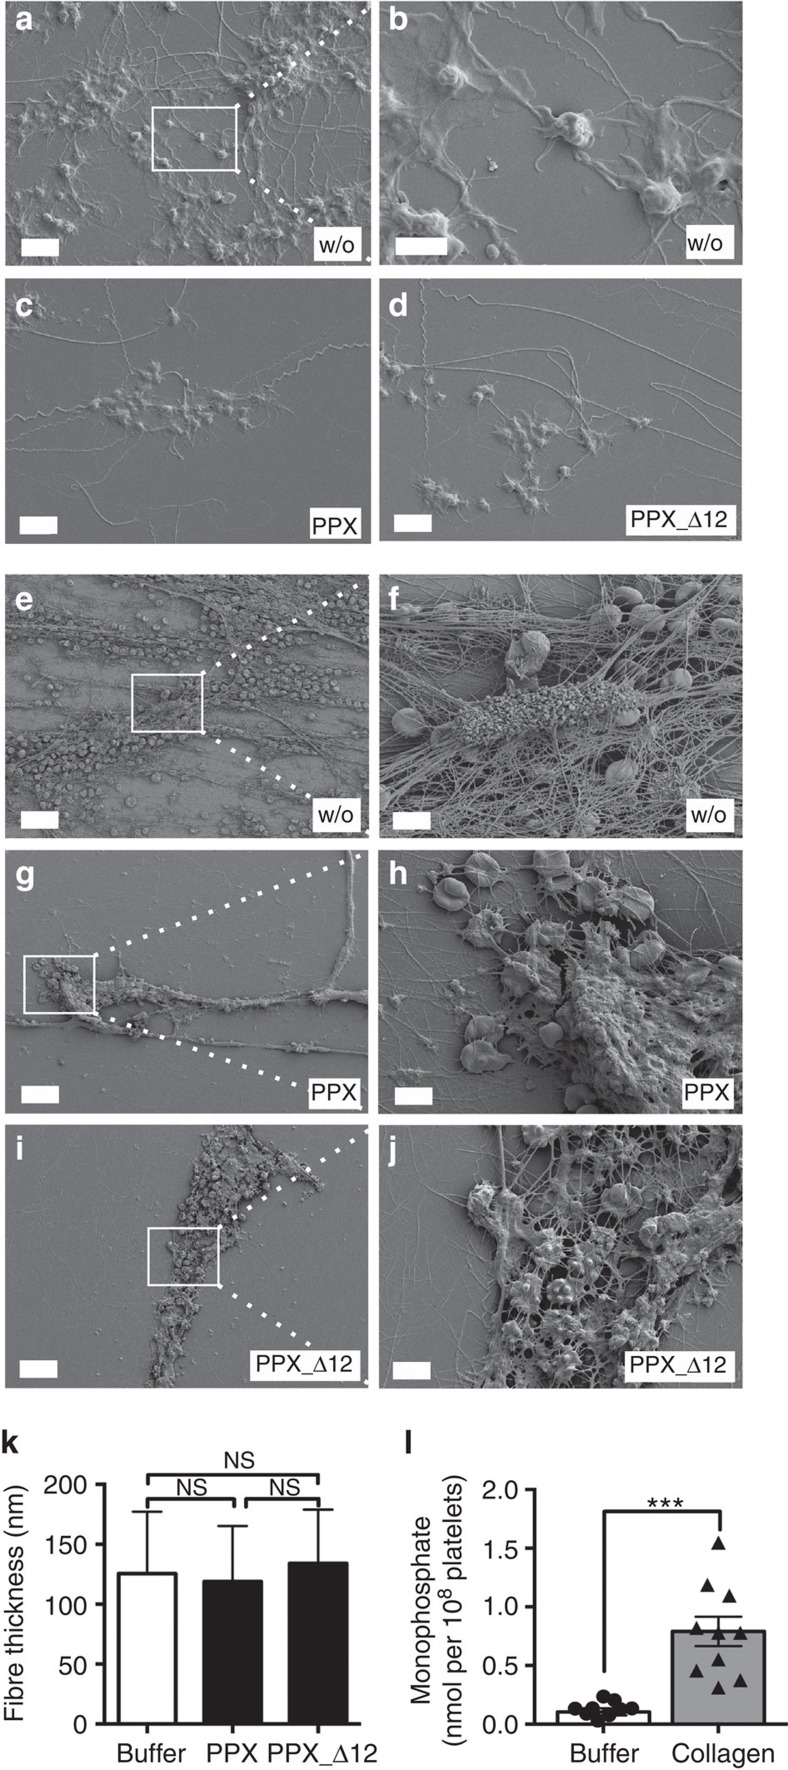
Figure 6. PPX and PPX_Δ12 do not alter fibrin composition.
Scanning electron microscopy images of thrombi formed in Fig. 5 under flow. Scanning electron micrographs of thrombi formed in full blood under arterial (a–d) or venous (e–j) shear rates in the presence of buffer (w/o), PPX or PPX_Δ12 (1 mg ml−1 each). White squares denote the area that is enlarged in b, f, h and j). Scale bar, 25 μm (e,g,i); 5 μm (a,c,d,f,h,j); 2 μm (b). (k) Fibre thickness measured from scanning electron micrographs of 25 fibres in three representative areas. Mean±s.e.m., NS=non-significant by one-way analysis of variance. (l) Human platelets were incubated for 20 min with buffer or collagen (10 μg ml−1). Released polyP was measured by increase of phosphate in PPX- (50 μg ml−1) versus buffer-treated platelet supernatants. Phosphate was calculated from malachite green absorbance at 650 nm from a standard curve. Mean±s.e.m., n=10, ***P<0.001 by Student's t-test.

