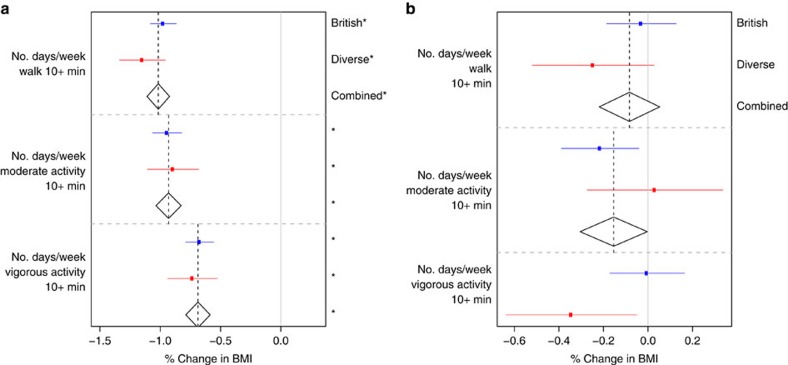
Figure 2. Main effects and interactions with FTO of activity variables.
For the components of the activity score, the estimated (a) main effects on BMI (% change in BMI per s.d.) and (b) interaction effects with FTO on BMI (% change in BMI per FTO risk allele per s.d.). All main and interaction effects were fitted jointly in the ‘Activity' Model (Table 2) in both the British (n∼90,000) and Diverse (n∼30,000) Samples. The estimated effects are shown along with their 95% confidence intervals in both the British (blue) and Diverse (red) Samples along with the combined estimate from a fixed effects meta-analysis when no significant heterogeneity between samples was observed (diamonds). A star on the right indicates a P value below the Bonferroni-corrected significance threshold of 0.05/25=0.002.

