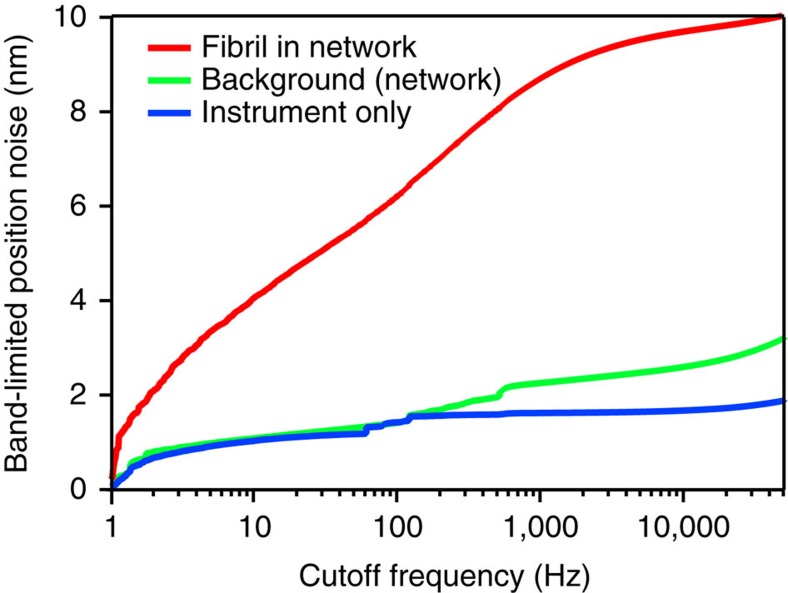
Figure 4. Magnitude of lateral fluctuations of a collagen fibril in a network.
Most of the power of the fibril's lateral fluctuations is distributed over the acoustic frequency regime; the curve plateaus at high frequencies, as expected (red curve). The motion of the fibril can be easily separated from the background noise caused by the out-of-focus rest of the network (green curve) and from position noise of the instrument (blue curve). The position fluctuations were recorded with a sampling rate of 100 kHz at 1 MHz electronic bandwidth.

