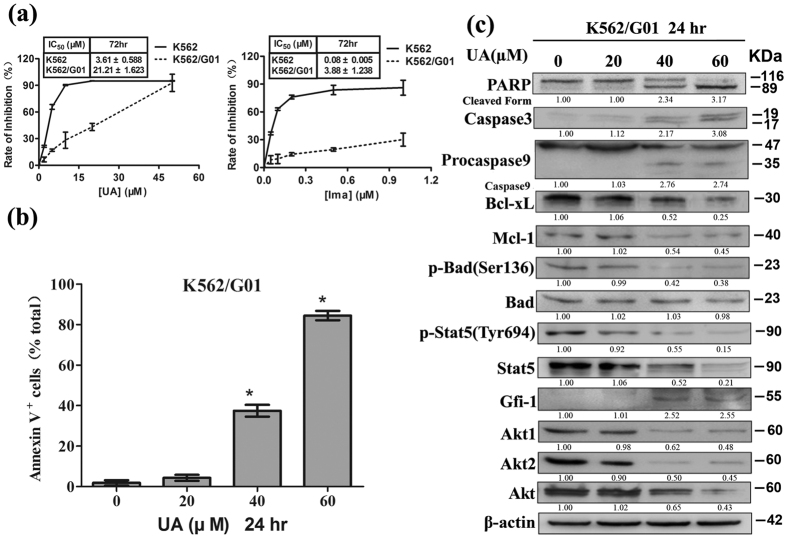
Figure 6. UA induces apoptosis in K562/G01.
(a) After cells exposed to UA and Imatinib individually at various concentrations for 72 hr, cell viability was assessed by MTT (Error bars represent SD). The concentration required to cause a 50% reduction in cell viability (IC50) was calculated and shown as mean ± SD of mean in the inset box. After cells exposed to UA at various concentrations for 24 hr, (b) Annexin V-FITC/propidium iodide FACS was conducted to determine the percentage of apoptotic cells. Columns, mean; bars, SD; *P < 0.001 versus control, calculated by ANOVA, and (c) Western blot analysis was conducted to determine protein expression of PARP, Caspase3, Procaspase9, Bcl-xL, Mcl-1, p-Bad at Ser136, Bad, p-Stat5 at Tyr694, Stat5, Gfi-1, Akt1, Akt2, and Akt. These experiments were repeated with similar results.

