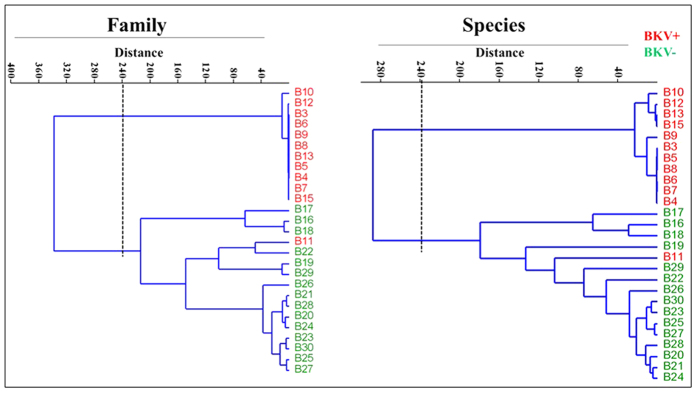
Figure 2. Cluster analysis of the urine virome.
The cluster analysis is based on hierarchical cluster using the Ward’s method with the Pearson’s correlation distance metric at taxonomic rank of the virus family and species identified in the samples. Each line in the cluster corresponds to a sample name and is color coded to show BKV+ (red) and BKV− (green) group.

