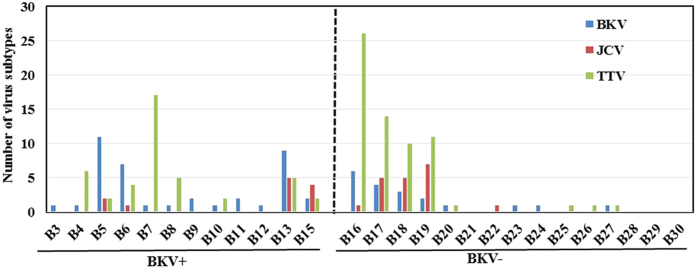
Figure 7. Identification of virus subtypes.
The bar chart represents the number of BKV, JCV, and TTV subtypes identified in each patient, In the BKV+ group, at least one virus subtype was detected in each patient, and multiple subtypes of other virus were detected in some patients in BKV+ group. In the BKV− group, four samples were detected that contained subtypes of all 3 viruses including BK, JC and TT virus.

