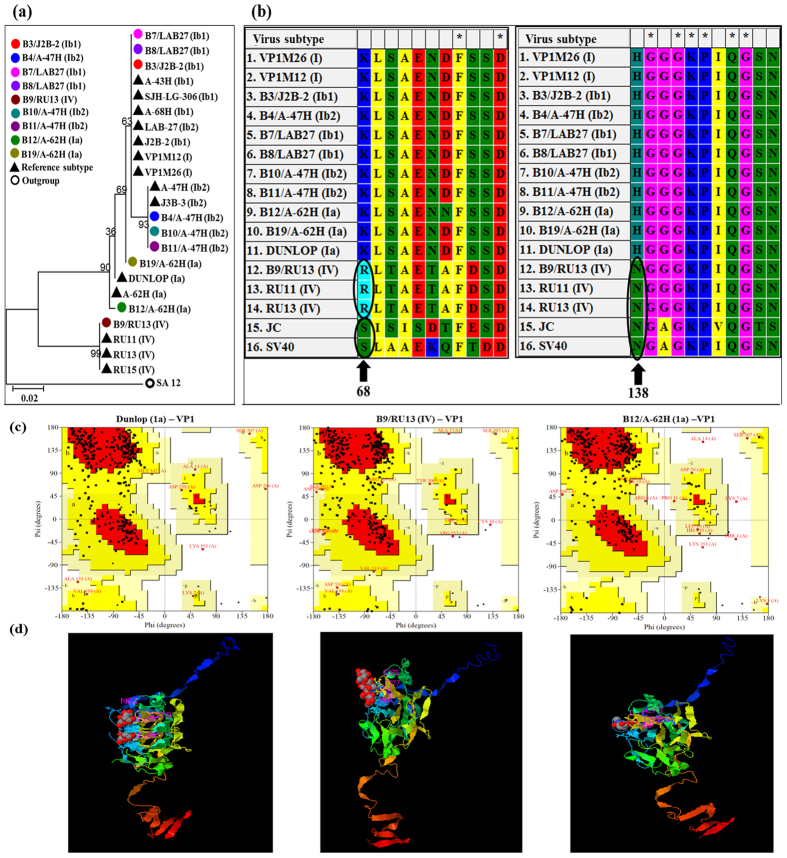
Figure 8. Analysis of the VP1 protein of BK virus.
(a) Phylogenetic analysis of VP1. Phylogenetic tree based on the sequences of the VP1 region of the 14 reference BKV strains and 9 sequences described in this study. The evolutionary history was inferred by using the maximum likelihood method based on the Tamura-Nei model. The bootstrap consensus tree inferred from 100 replicates is taken to represent the evolutionary history of the taxa analyzed. The tree is drawn to scale, with branch lengths measured in the number of substitutions per site. SA12 (simian agent 12, a baboon polyoma virus) was used as an out group. (b) Multiple sequence alignment of VP1 protein reveals amino acid variations in VP1 protein. (c) The Ramachandran plot for the phi-psi torsion angles for residues in the VP1 protein of Dunlop (1a) (reference BKV subtype), B9/RU13 (IV) and B12/A-62H (1a) from BKV+ kidney transplant group. Glycine residues are separately identified by triangles. The coloring/shading on the plot represents the different regions described in Morris et al.47: the darkest areas (red) correspond to the “core” regions representing the most favorable combinations of phi-psi values. Over 90% of the residues in the “core” regions predicts a good quality structure model. The different regions on the Ramachandran plots are labelled as follows: A - Core alpha L - Core left-handed alpha a - Allowed alpha l - Allowed left-handed alpha ~a - Generous alpha ~l - Generous left-handed alpha B - Core beta p - Allowed epsilon b - Allowed beta ~p - Generous epsilon ~b - Generous beta. (d) Predicted 3D structure of the VP1 protein. For reference BKV isolate name is followed by subtype in parenthesis. Samples analyzed in the study are labelled as - sample name/isolate name (subtype).

