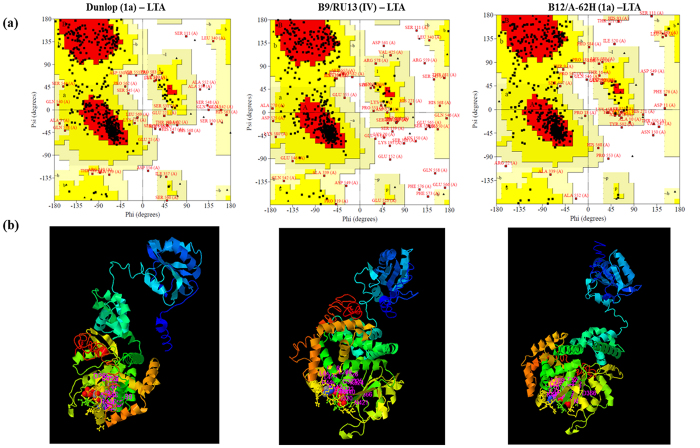
Figure 9. Analysis of Large T antigen protein of BK virus.
(a) The Ramachandran plot for the phi-psi torsion angles for residues in the LTA protein of Dunlop (1a) (reference BKV subtype), B9/RU13 (IV) and B12/A-62H (1a) from BKV+ kidney transplant group. The coloring/shading on the plot represents the different regions described in Morris et al.47: the darkest areas (red) correspond to the “core” regions representing the most favorable combinations of phi-psi values. Over 90% of the residues in the “core” regions predicts a good quality structure model. The different regions on the Ramachandran plots are labelled as follows: A - Core alpha L - Core left-handed alpha a - Allowed alpha l - Allowed left-handed alpha ~a - Generous alpha ~l - Generous left-handed alpha B - Core beta p - Allowed epsilon b - Allowed beta ~p - Generous epsilon ~b - Generous beta. (b) Predicted 3D structure of the LTA protein.

