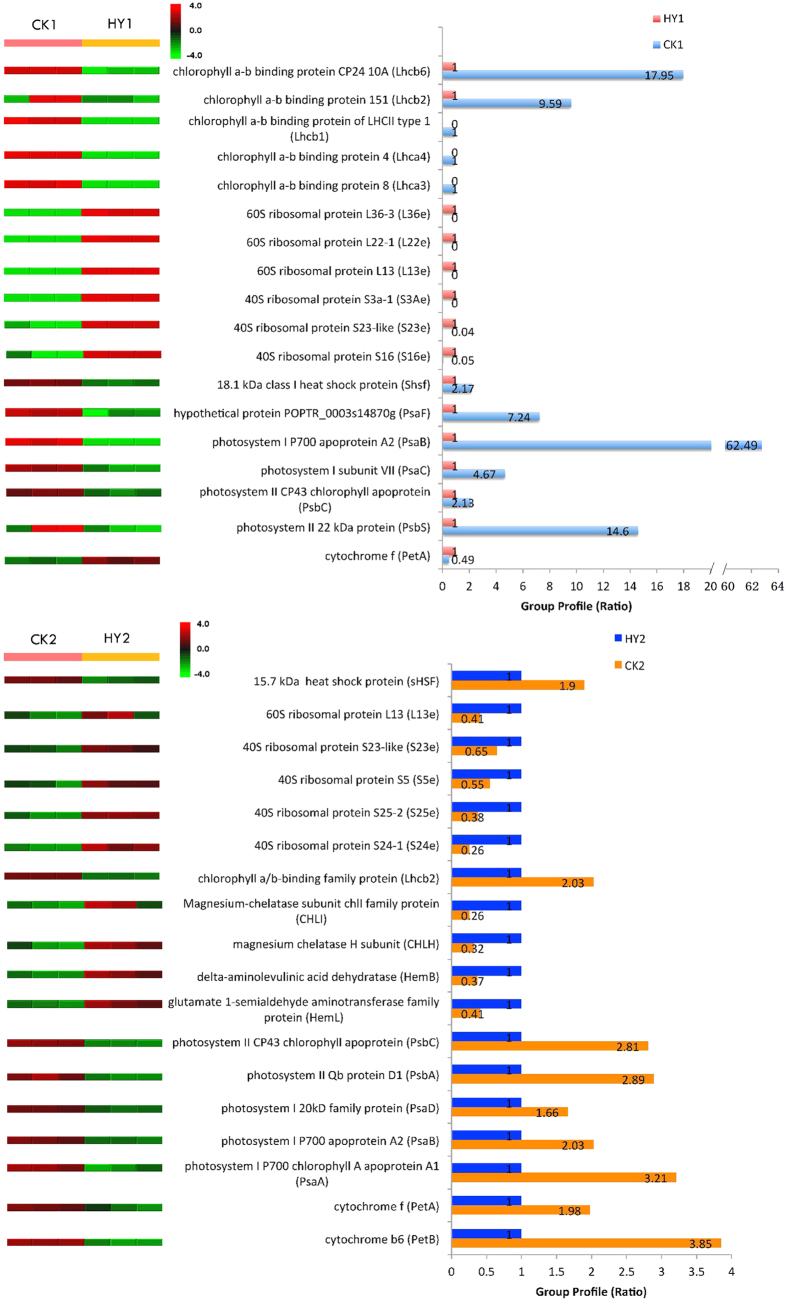
Figure 3. Quantitative comparison of several differentially expressed proteins between the variants and the CKs.
The right panels represent the fold change of the individual protein, and the left panels represent the reproducibility in three independent biological experiments. The up- or down-regulated proteins are indicated by the red and green colour code, respectively. The colour intensity changes with the protein expressional level.

