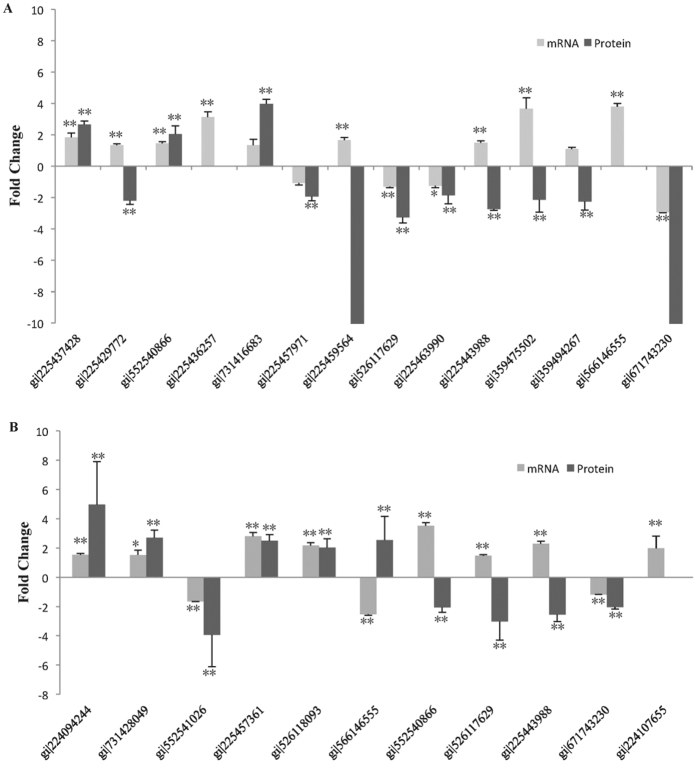
Figure 6. Quantitative real time PCR analyses of fourteen and eleven differentially expressed proteins at mRNA level, respectively.
(A) The black and the gray bars represent fold changes of protein and mRNA between HY1 and CK1, respectively. The positive values indicate higher expression in the HY1 and negative values denote higher expression in CK1. (B) The black and the gray bars represent fold changes of protein and mRNA between HY2 and CK2, respectively. The positive values indicate higher expression in the HY2 and negative values denote higher expression in CK2. Error bar is standard deviation. *indicates significant difference (P < 0.05) at mRNA level, **refers to significant difference at 0.01 level at mRNA and protein level.

