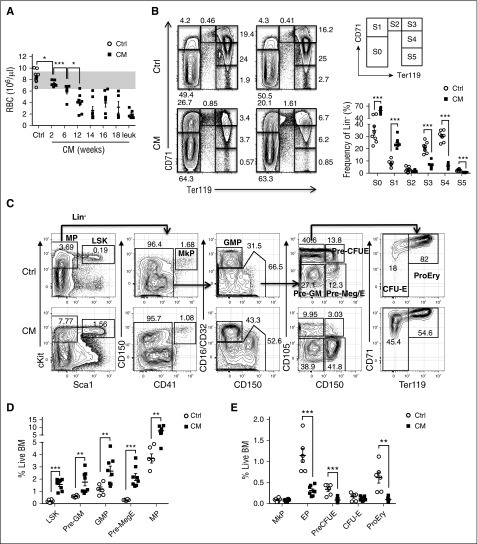
Figure 1.
CM expression leads to preleukemic expansion of a phenotypic Pre-Meg/E progenitor population. (A) RBC counts in peripheral blood of CM mice (n = 5-8) over time (2-18 weeks) and when moribund with leukemia (n = 6) compared with similarly treated control mice (n = 13). The gray area indicates the typical normal range. (B) Representative FACS plots showing various erythroid progenitor subsets defined by the expression of Ter119 and CD71 in CM-expressing preleukemic BM 2 weeks after poly (I:C) compared with control (Ctrl) BM analyzed by flow cytometry. Numbers indicate the frequency of each gate in Lin− BM cells. Right panel shows the gating strategy (top) and the frequency of each phenotypic erythroid subsets (S0-S5) in Lin− BM as defined above (bottom). Mean ± standard error of the mean (SEM; Ctrl, n = 8: CM, n = 8) are shown. (C) Representative FACS plots showing the gating strategy of various phenotypic progenitor populations in CM preleukemic BM compared with Ctrl BM analyzed by flow cytometry. The frequency within total BM is shown for LSK and MP (first plot from left), and the frequency in the respective parent gate is shown for the other populations. (D-E) Frequency of various CM (n = 8) or Ctrl (n = 6) phenotypic progenitor populations in total BM as defined above. Mean ± SEM is shown. *P < .05; **P < .01; ***P < .001.

