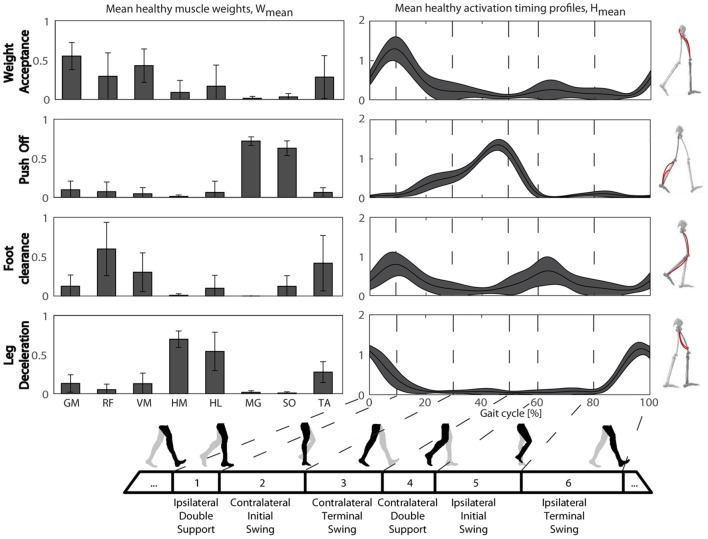
Figure 3.
The physiological muscle synergies: muscle weights (Left panel) and temporal activation profiles (Right panel) obtained during overground walking. Mean values and standard deviation are reported in both panels. GM, gluteus maximus; RF, rectus femoris; VM, vastus medialis; HM, hamstring medialis; HL, hamstring lateralis; MG, gastrocnemius medialis; TA, tibialis anterior.

